View larger version:
Download Original File
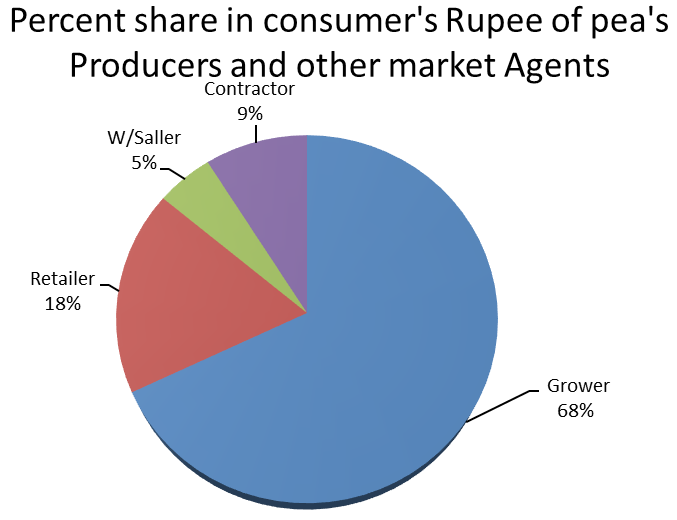
Figure 2
Pie Chart of Percentage share of Consumer’s Rupee of Pea’s growers and other market Agents.
