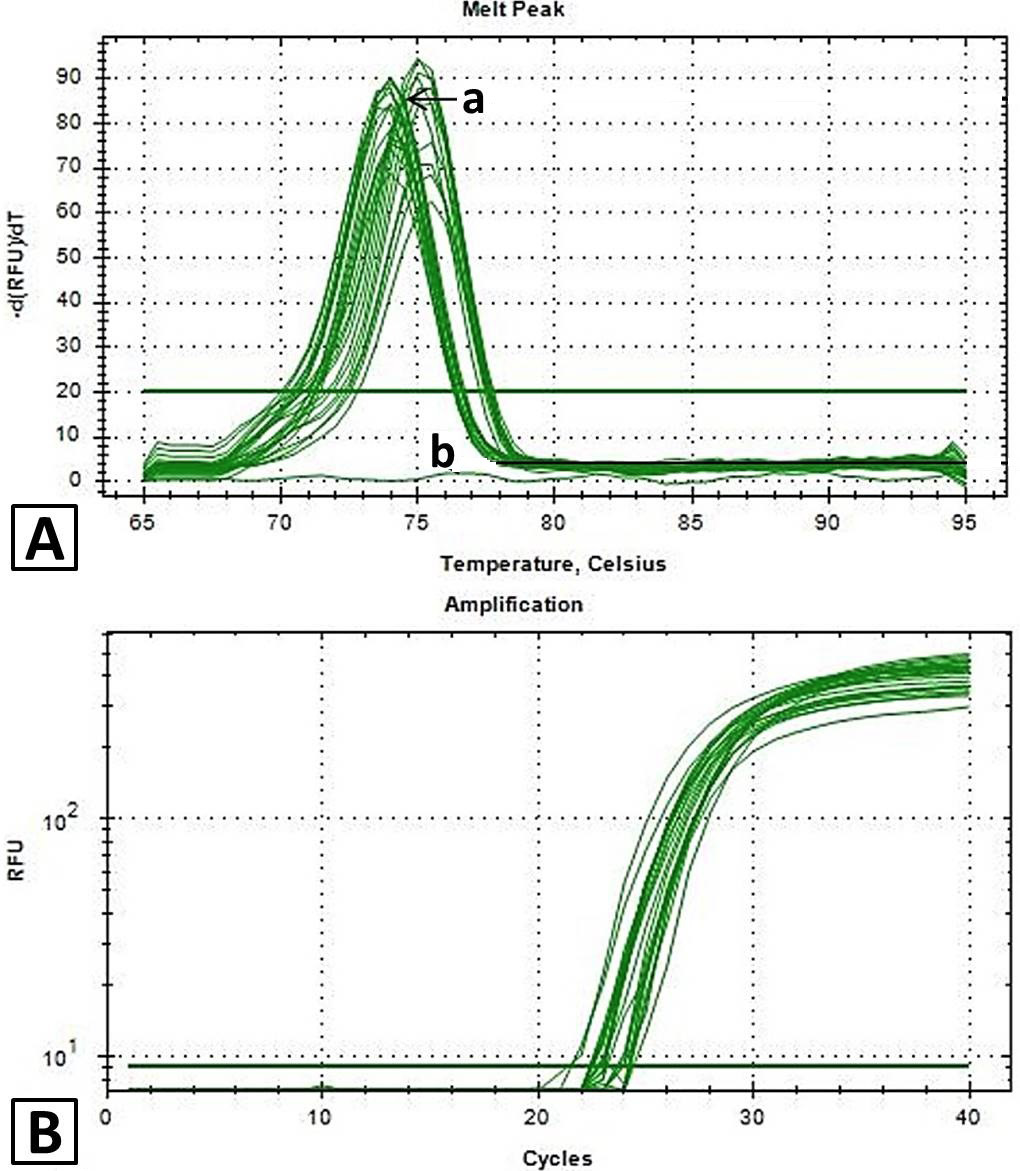
Fig. 3.
A, melt curve analysis of candidate reference genes for normalization of qPCR in ALL. A singe peak at melting temperature 75.5°C showed amplified products are specific and no non-specific amplification were occurred (a, specific amplification curves; b, NTC-no template control); B, amplification curves of candidate reference genes through qPCR in ALL showing relative fluorescence unit (RFU) of more than 103.