View larger version:
Download Original File
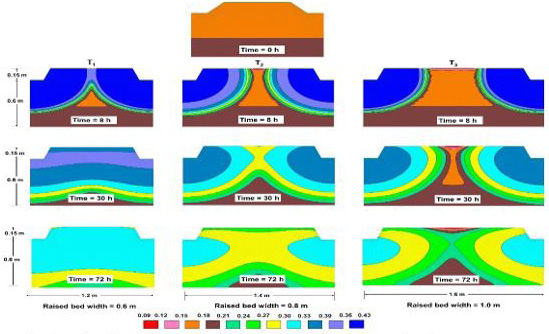
Figure 6
Simulated soil patterns at different time intervals for treatments T1, T2 and T3.