
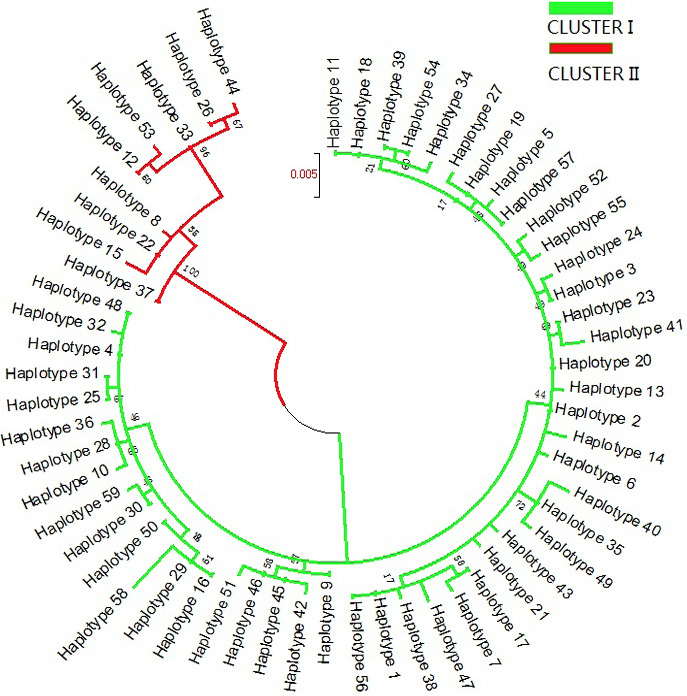
Molecular phylogenetic analysis of 59 Naqu yak mtDNA D-loop haplotypes using the maximum likelihood method. The evolutionary history was inferred using the maximum likelihood method based on the Tamura-Nei model (Tamura and Nei, 1993). The tree with the highest log likelihood (-1693.9317) is shown. The percentage of trees in which the associated taxa clustered together is shown next to the branches. Initial tree(s) for the heuristic search were obtained automatically by applying the neighbor-joining and BioNJ algorithms to a matrix of pairwise distances estimated using the maximum composite likelihood (MCL) approach and then selecting the topology with a superior log likelihood value. The rate variation model allowed some sites to be evolutionarily invariable ([+I], 46.4858% sites). The tree is drawn to scale, with branch lengths measured in the number of substitutions per site. The analysis involved 59 nucleotide sequences. A total of 811 positions were included in the final dataset.