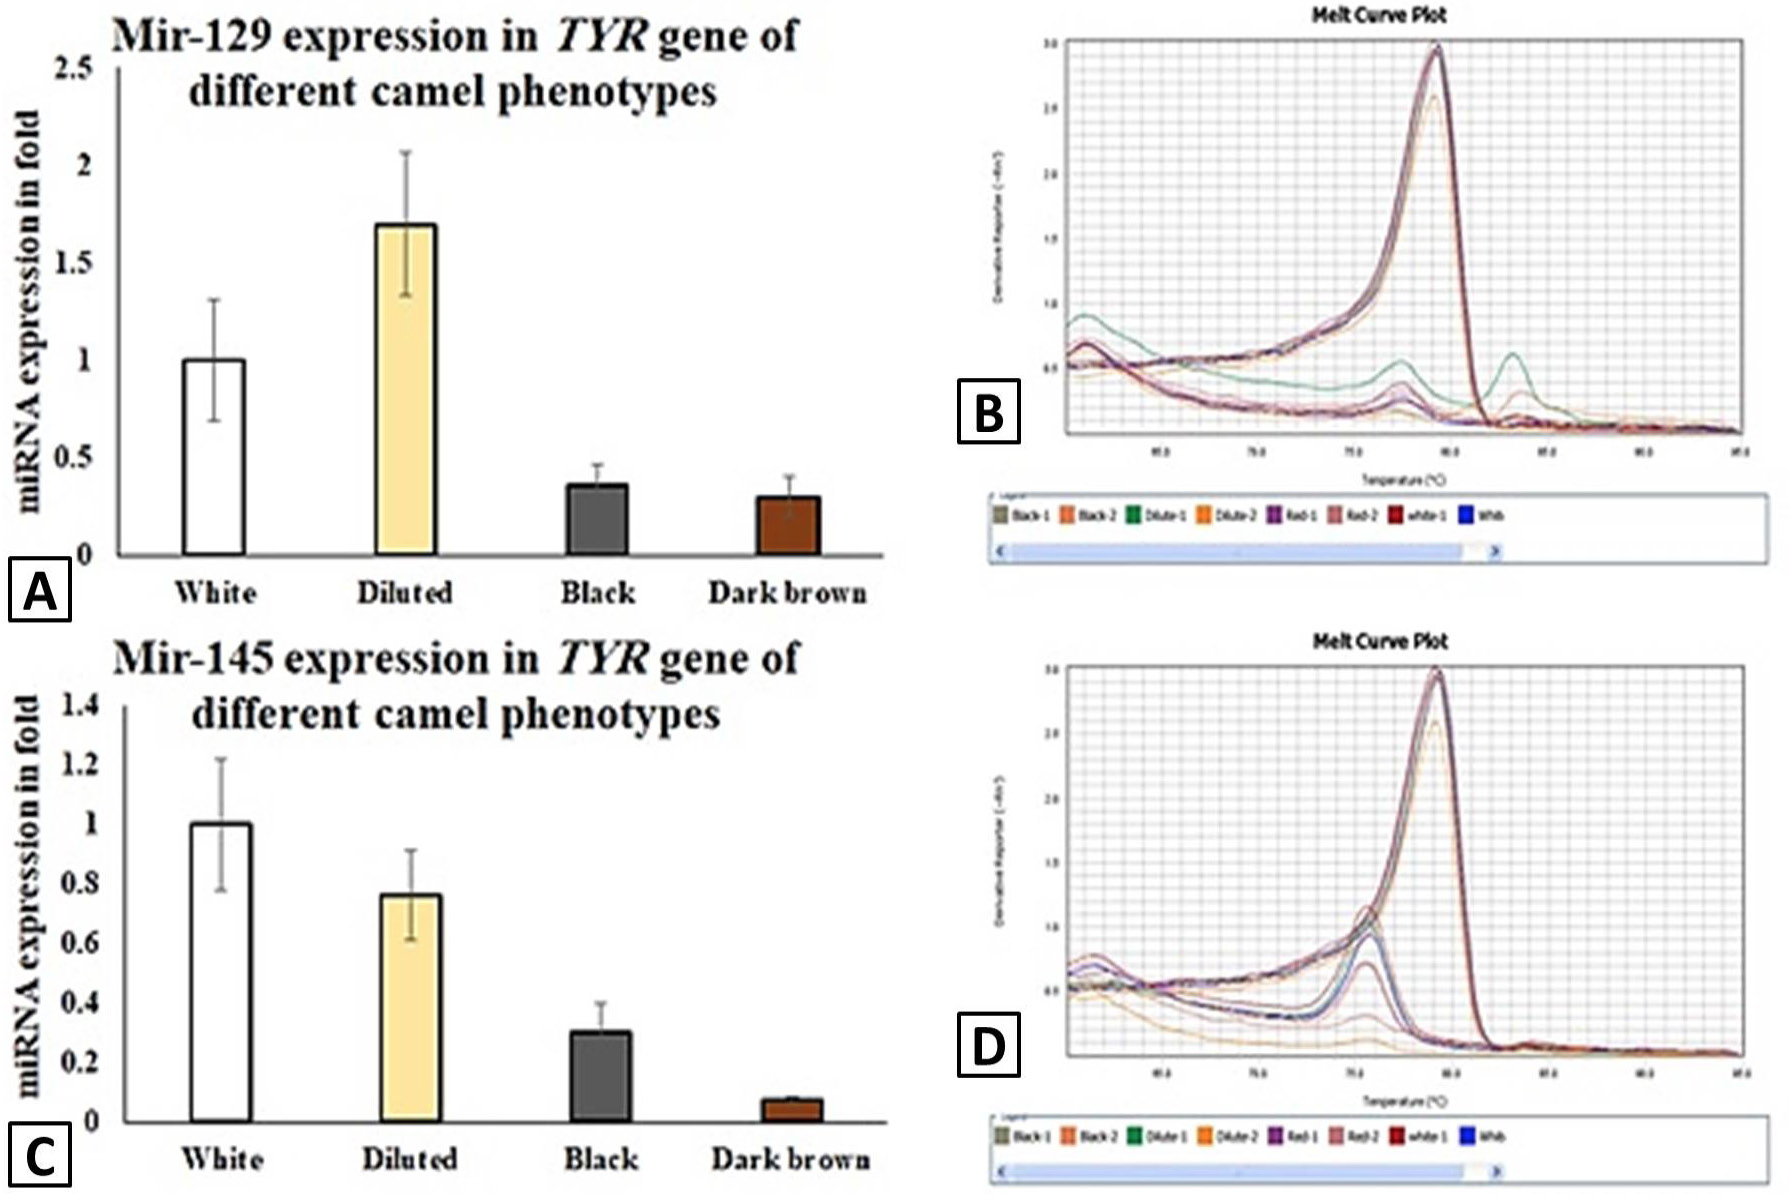
Fig. 2.
A, MiR-129-5p expression in different phenotypic dromedary camels showing highest in diluted and lowest in dark brown camels. B, MiR-129 melt-curve showing uniform expression at 790°C. C, MiR-145 expression in different phenotypic dromedary camels showing highest expression in white and significantly low in dark brown camels. D, MiR-145 melt-curve showing uniform expression at 790 C.