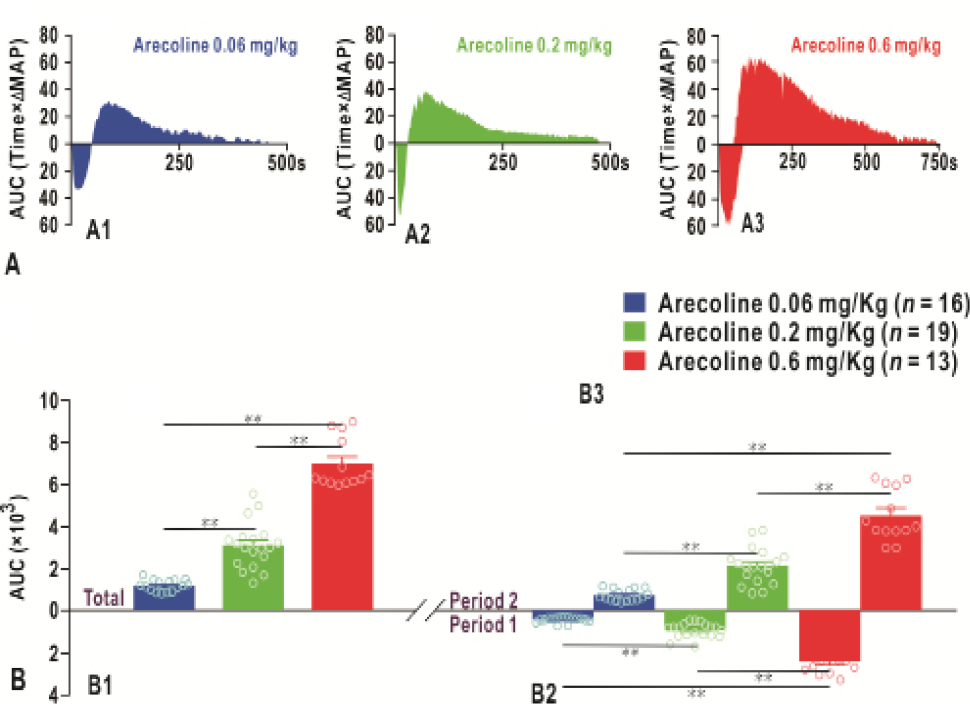
Fig. 6.
The area under curve (AUC, MAP change relative to the reaction time) after intravenous injections of arecoline. (A) Representative AUCs of different treatment groups (0.06, 0.2 and 0.6 mg/kg of arecoline). (B) Histograms of the AUCs among groups; B1, the total AUC; B2, AUC in Period 1; B3, AUC in Period 2. *P < 0.05; **P < 0.01.