Figure 5:
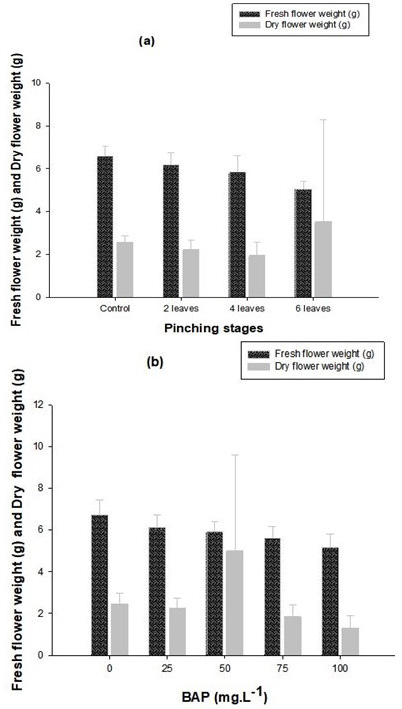
Fresh flower weight (g) and dry flower weight of zinnia as affected by (a) Pinching stages and (b) BAP concentrations.
Fresh flower weight (g) and dry flower weight of zinnia as affected by (a) Pinching stages and (b) BAP concentrations.