
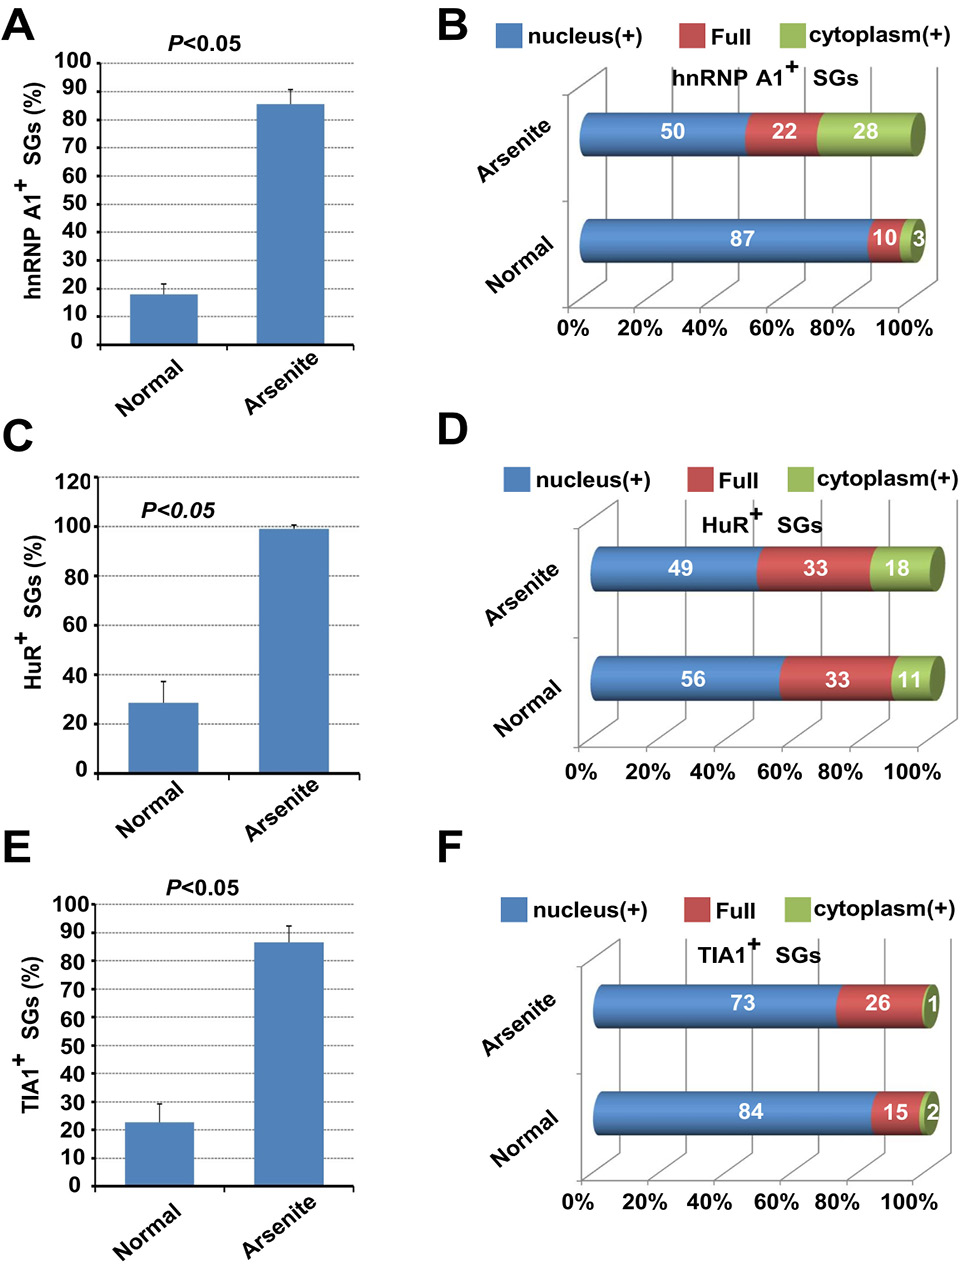
Fig. 2.
Quantification analysis for nucleus/cytoplasm localization of hnRNP A1, HuR and TIA1 upon oxidative stress. The percentage of hnRNP A1 (A), HuR (C), TIA1 (E) marked SG positive cells were measured, respectively. An independent-sample Student’s T Test was performed using SPSS 16.0. P<0.05 means significant difference. The ratio of cells with the nucleus-localized signal, cytoplasm-localized signal, or full cell-localized signal of hnRNP A1 (B), HuR (D), and TIA1 (F) in all selected cells was also calculated, respectivly.