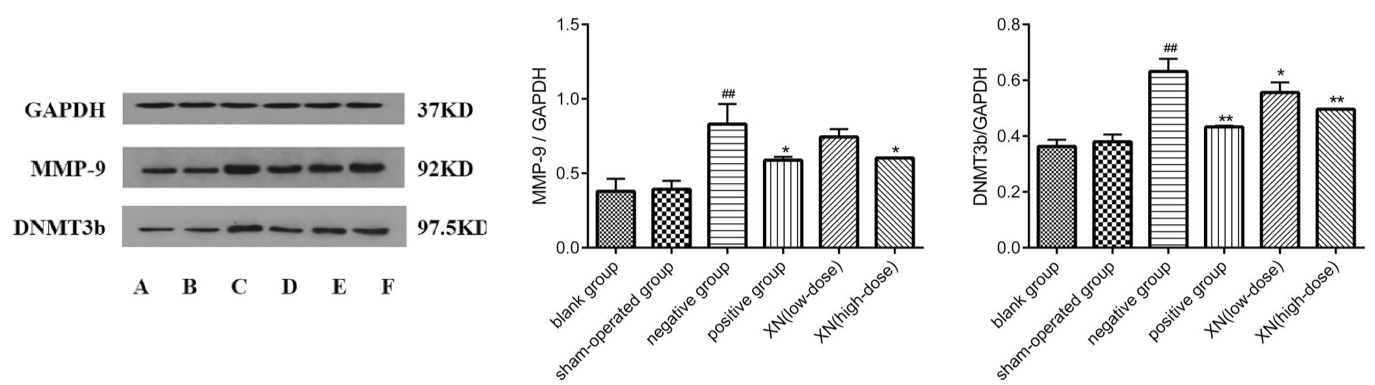
Fig. 4.
SDS-PAGE effect of XN on the expression of MMP-9 and DNMT3b in ICH rats. Western blot results showed expressions of MMP-9 and DNMT3b in blank group(A), sham-operated group (B), model group (C), AGNH group (D), and XN-treated (low/high doses, E/F) groups. Protein expressions are normalized with their respective glyceraldehyde 3-phosphate dehydrogenase (GAPDH) controls and the results are also represented in a bar graph showing MMP9 and DNMT3b band intensity, normalized with GAPDH band intensity. Data represent mean±SEM (#P<0.05, ##P<0.01, versus sham-operated group; *P<0.05, **P<0.01, versus model group); data analyzed from six independent experiments (n=6).