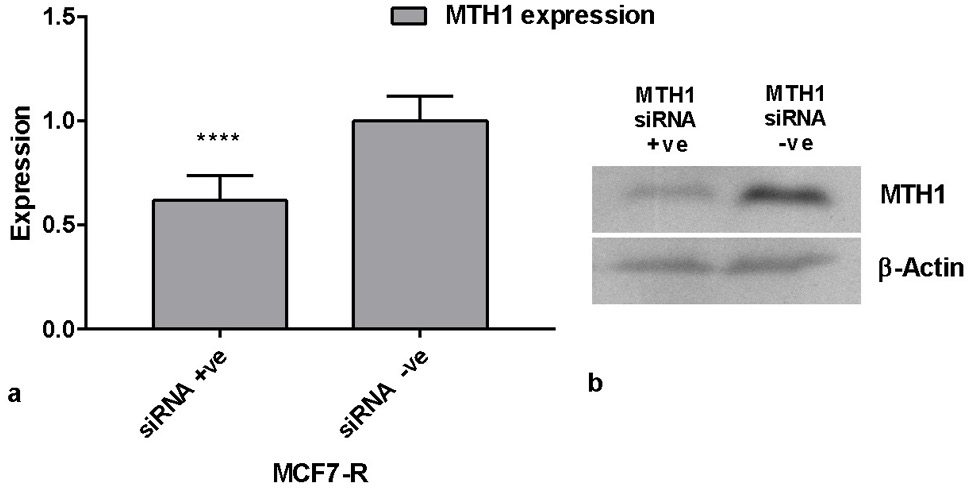
Fig. 1.
a) MTH1 gene expression was analysed by qRT-PCR after MTH1 specific siRNA transfection. Student’s t-test analysis provided highly significant results for the comparison of +ve and –ve transfected samples (p-value <0.0001). b) Western blot analysis for MTH1 protein expression after MTH1 specific siRNA transfection. Percentage of MTH1 protein expression was quantified by ImageJ software and data was normalised with respect to MTH1 protein expression in –ve transfection group. β-actin expression was used as an experimental control. siRNA +ve and siRNA –ve indicate the expression of MTH1 in +ve and –ve transfected groups of MCF7-R cells respectively.