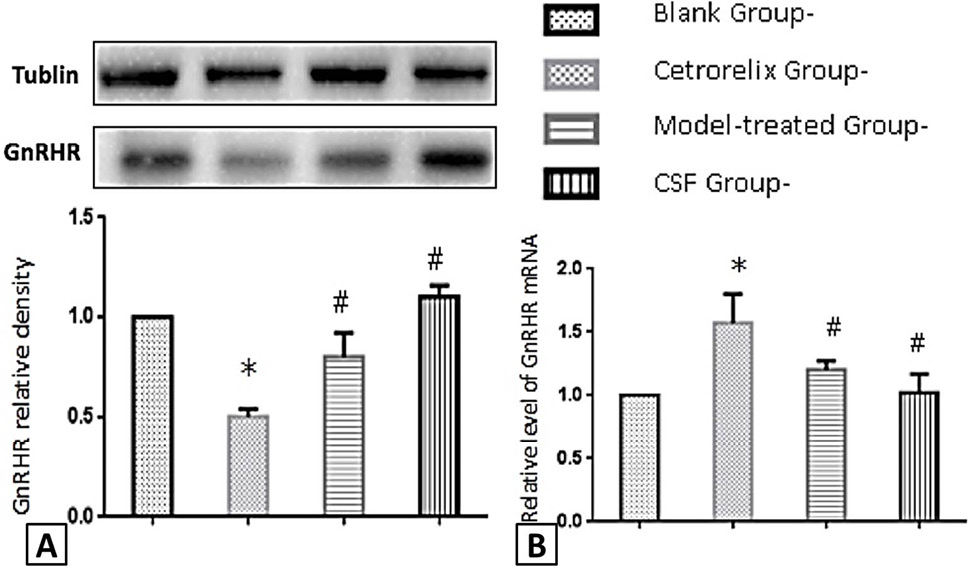
Fig. 1.
Comparison of mRNA and protein levels of GnRHR in RPC cells. A, mRNA levels of GnRHR in RPC cells; B, protein levels of GnRHR in RPC cells. *p<0.05 conpared to the blank group, #p<0.05 compared to the model-treated group.
Comparison of mRNA and protein levels of GnRHR in RPC cells. A, mRNA levels of GnRHR in RPC cells; B, protein levels of GnRHR in RPC cells. *p<0.05 conpared to the blank group, #p<0.05 compared to the model-treated group.