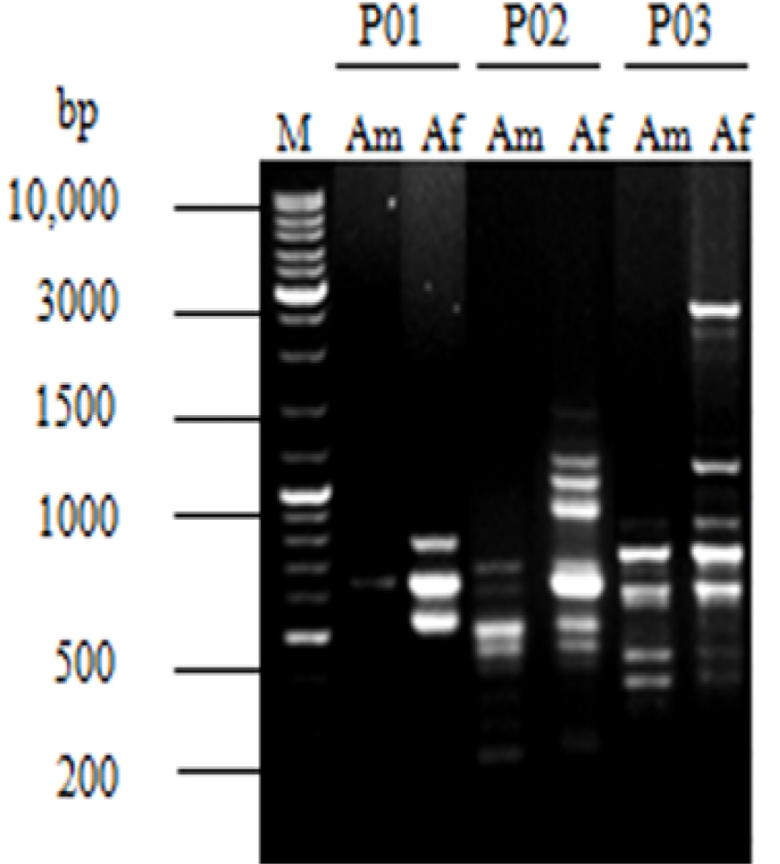
DNA banding profile of PCR-ISSR amplification product. M: DNA marker; Am: A. minisclerotigenes and Af: A. flavus.