Figure 3
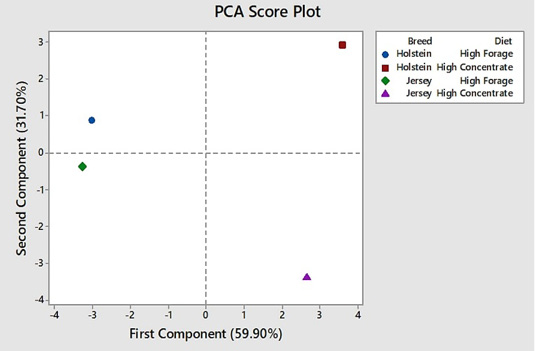
Principal component analysis (PCA) score plot represented the separation of both breeds and diets based on their rumen fermentation characteristics and species level relative abundance of rumen bacteria.
Principal component analysis (PCA) score plot represented the separation of both breeds and diets based on their rumen fermentation characteristics and species level relative abundance of rumen bacteria.