View larger version:
Download Original File
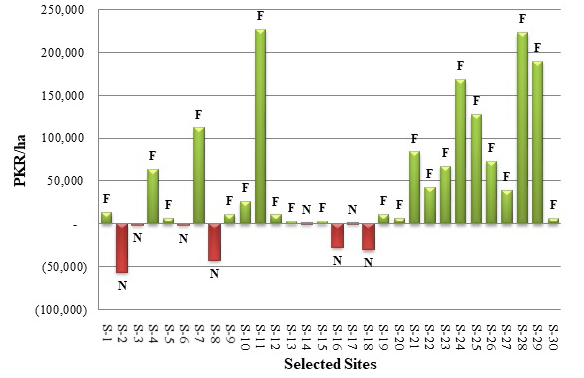
Figure 4
Net economic benefits (PKR/ha) for all 30 sites (F: Functional N: Non Functional S: Site).
