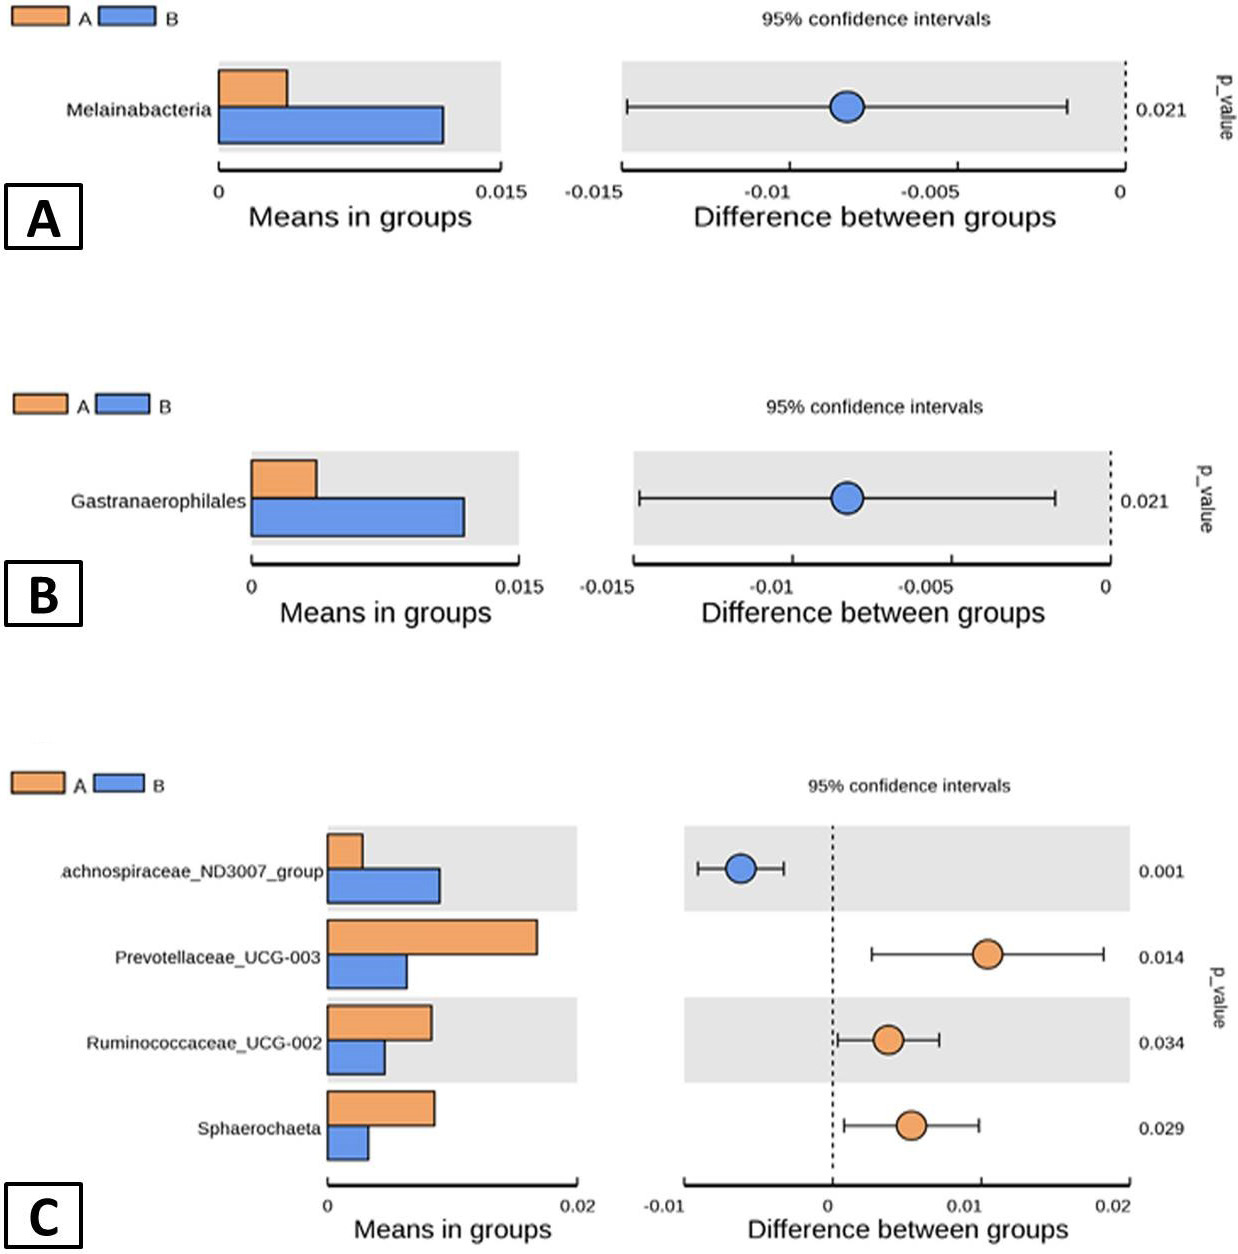
T-test difference group analysis diagram and at the class level (A), at the order level (B) and at the genus (C).
