
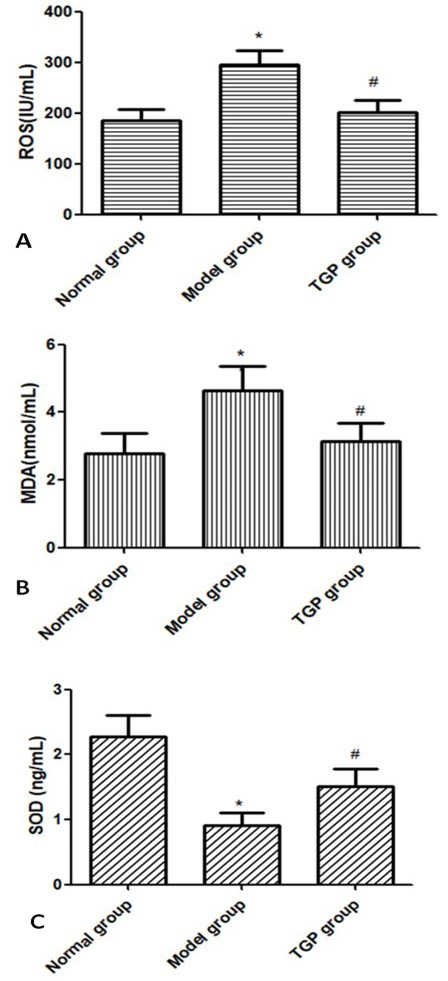
Fig. 2.
Effect of total glucoside of paeony on kidney ROS (A), MDA (B), and SOD (C) content in the three rat groups after 12 weeks of intervention (n=10). *P<0.05, compared with the normal group. #P<0.05, compared with the model group.
Effect of total glucoside of paeony on kidney ROS (A), MDA (B), and SOD (C) content in the three rat groups after 12 weeks of intervention (n=10). *P<0.05, compared with the normal group. #P<0.05, compared with the model group.