
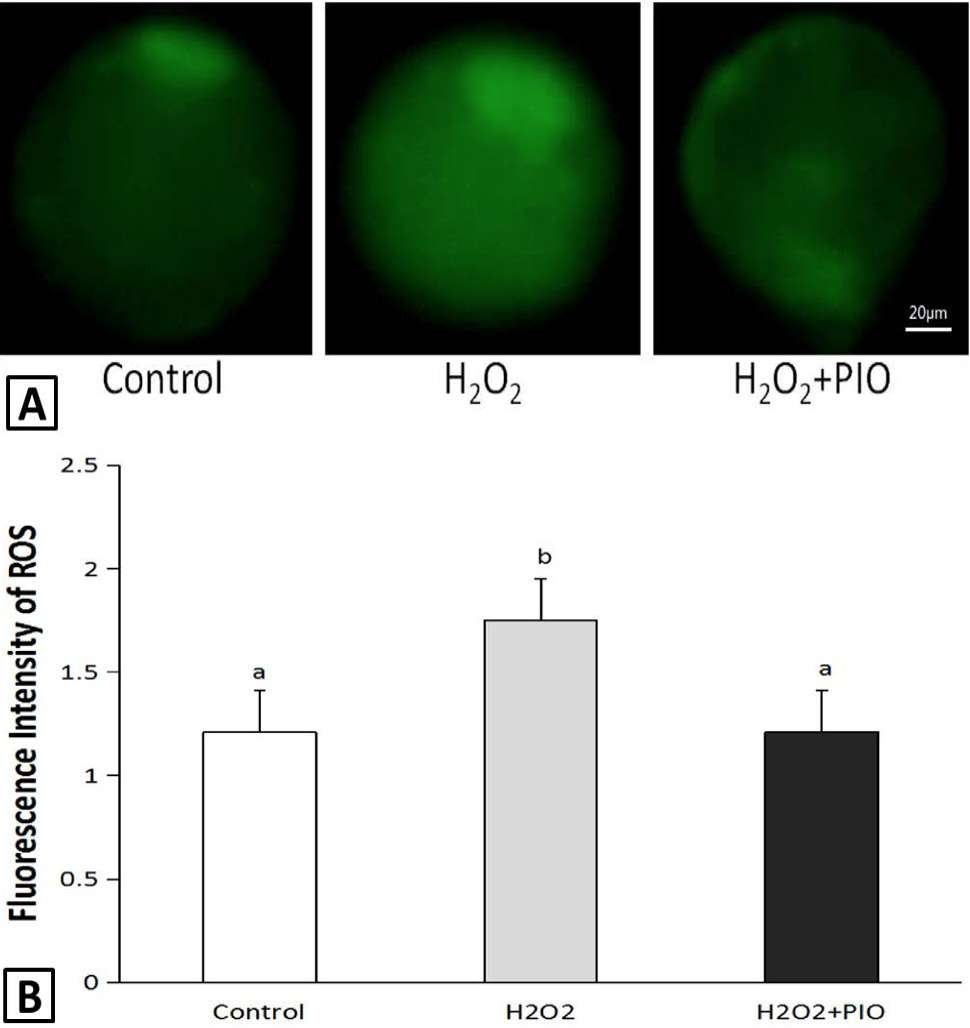
Fig. 1.
Evaluation of ROS content in blastocysts: A, representative photographs of ROS levels in mouse embryos after staining with DCHFDA; B, Fluorescence intensity was quantified by Image J. Data are expressed as a mean value ± SEM of three independent experiments. Different letters in the same picture mean the significant difference between the treatments (P < 0.05).