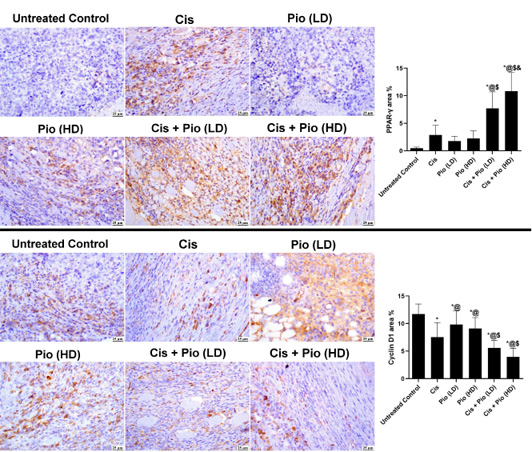
Figure 9
Histological sections immune stained with PPAR-γ and Cyclin D1 from solid tumor masses in different groups. Data are expressed as mean ± SD, one-way ANOVA followed by post hoc test Bonferroni. * Significant from the untreated control group, @ Significant from the cisplatin group, $ Significant from the Pio (LD) group, and & Significant from the Cis+ Pio (LD) group, p<0.05.