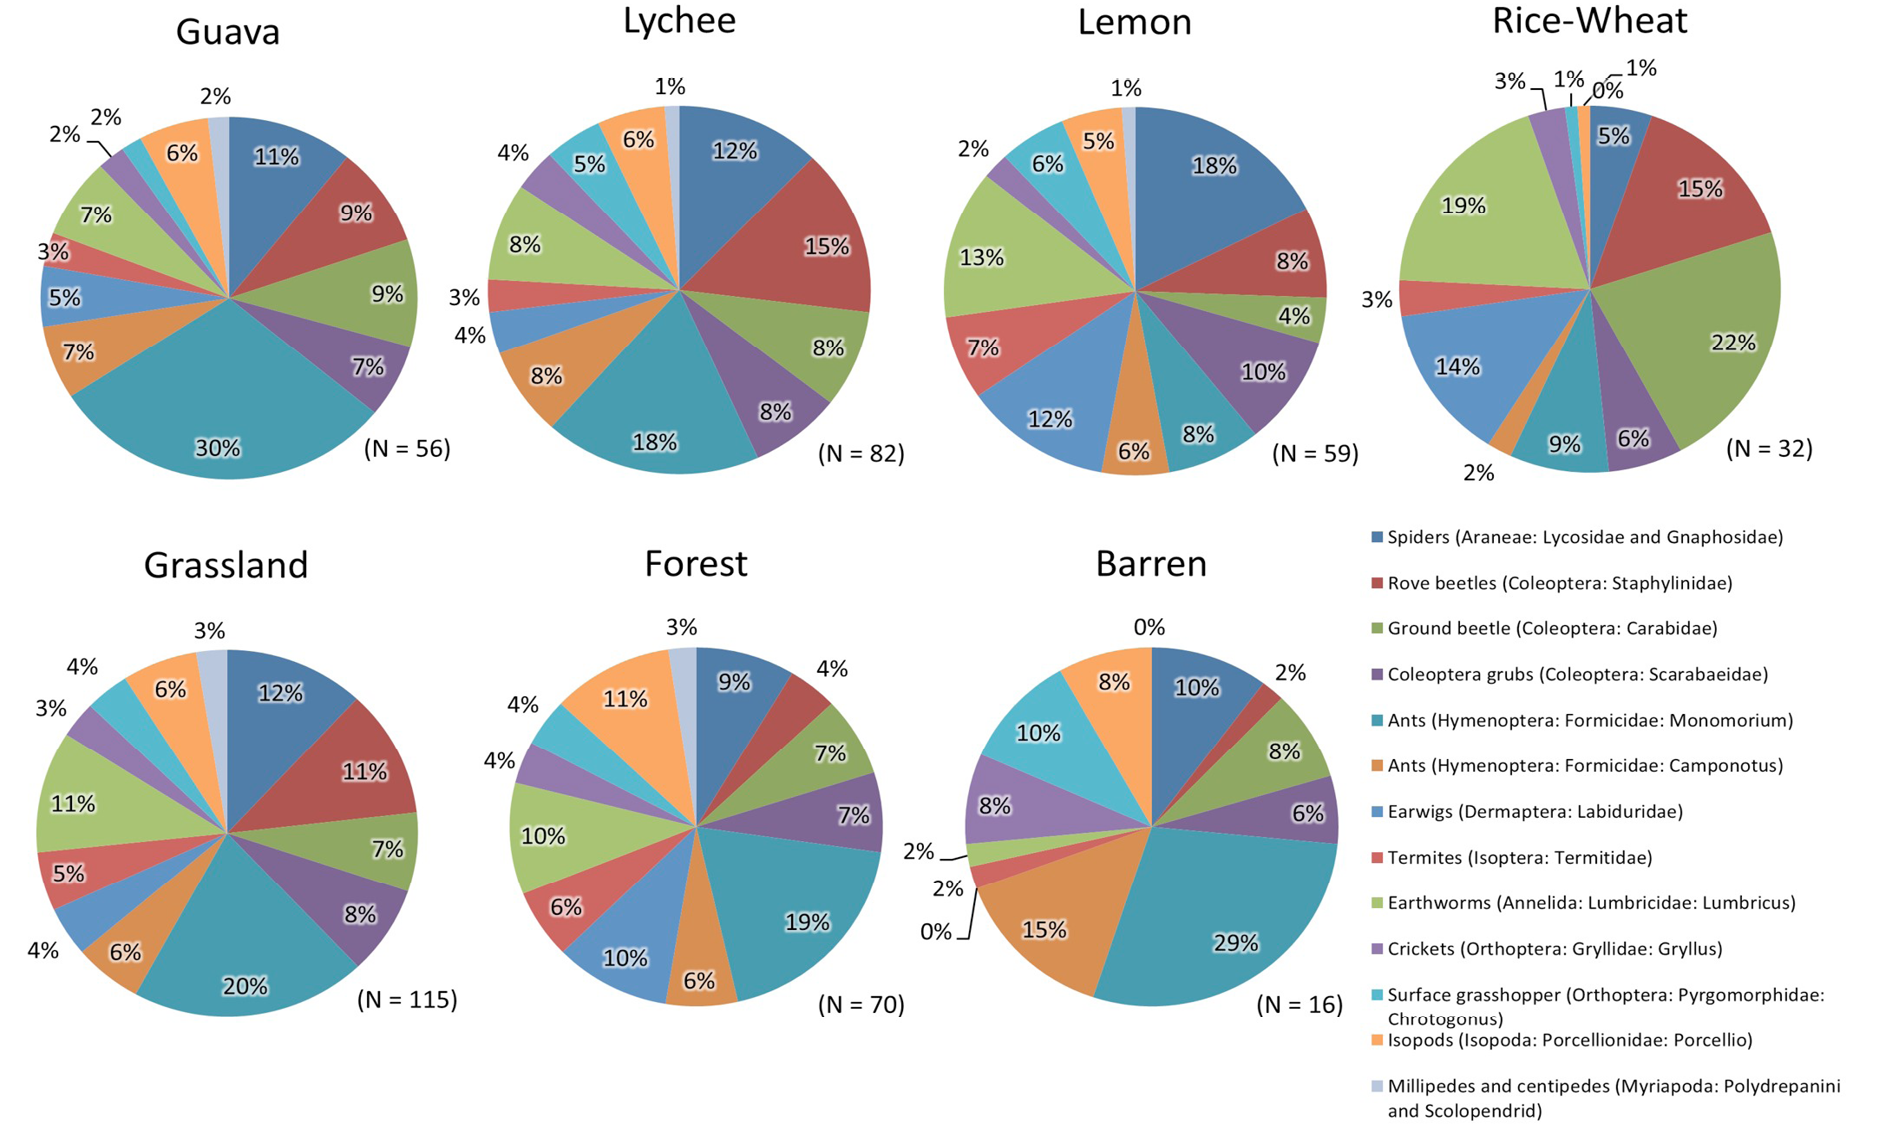
Fig. 5.
Pie charts showing community assemblages of edaphic macroinvertebrate groups captured from soils of different land-use types during winter 2015 and summer 2016. For each land-use type, values represent mean percent proportion of each macrofaunal group and “N” represents total number of macrofaunal individuals encountered.