Fig. 1.
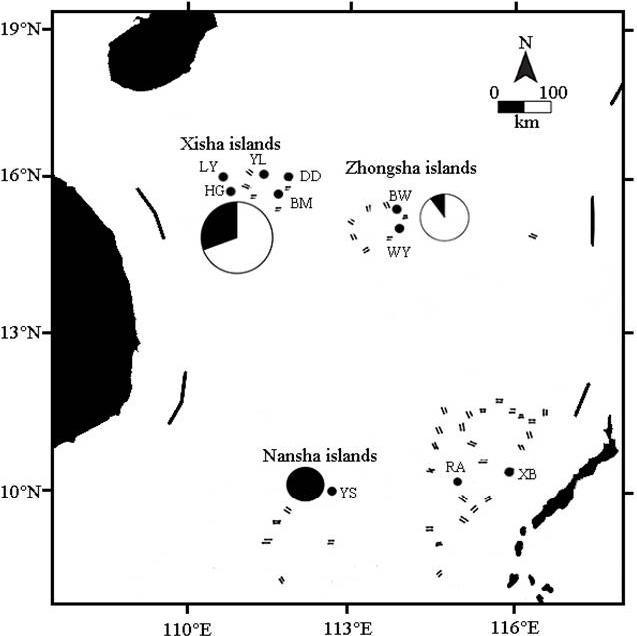
Sampling sites and haplotype frequencies in three groups. The area of the circle is proportional to sample size. White of the circle represents lineage A and black represents the lineage B.
Sampling sites and haplotype frequencies in three groups. The area of the circle is proportional to sample size. White of the circle represents lineage A and black represents the lineage B.