View larger version:
Download Original File
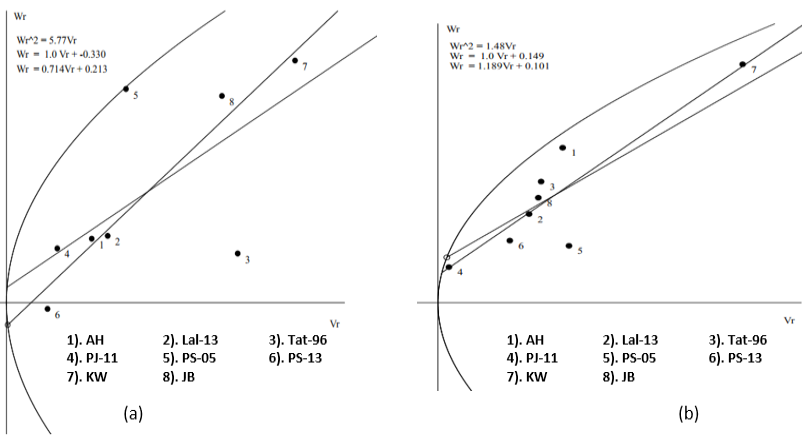
Figure 1
Wr/Vr graphs, a) Days to heading, and b) Spike length.
