
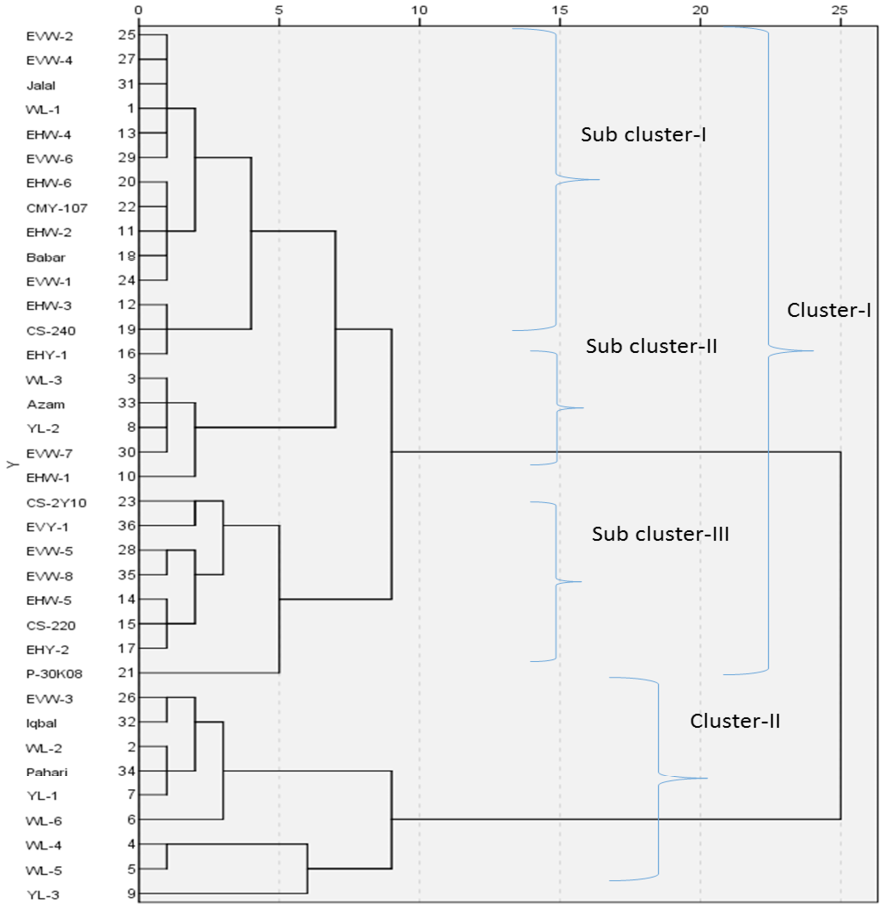
Figure 2:
Agglomerative hierarchical clustering of 36 maize genotypes based on Grain Yield (GY) and Disease Severity (DS) of southern corn leaf blight; Sub-cluster I: Genotypes were MR to MS with medium to high yielding potential; Sub-cluster II: Genotypes were HS with low yield potential; Sub-cluster III: Genotypes were MR to MS with high yield potential; Cluster II: Genotypes were MS to HS with low yield potential.