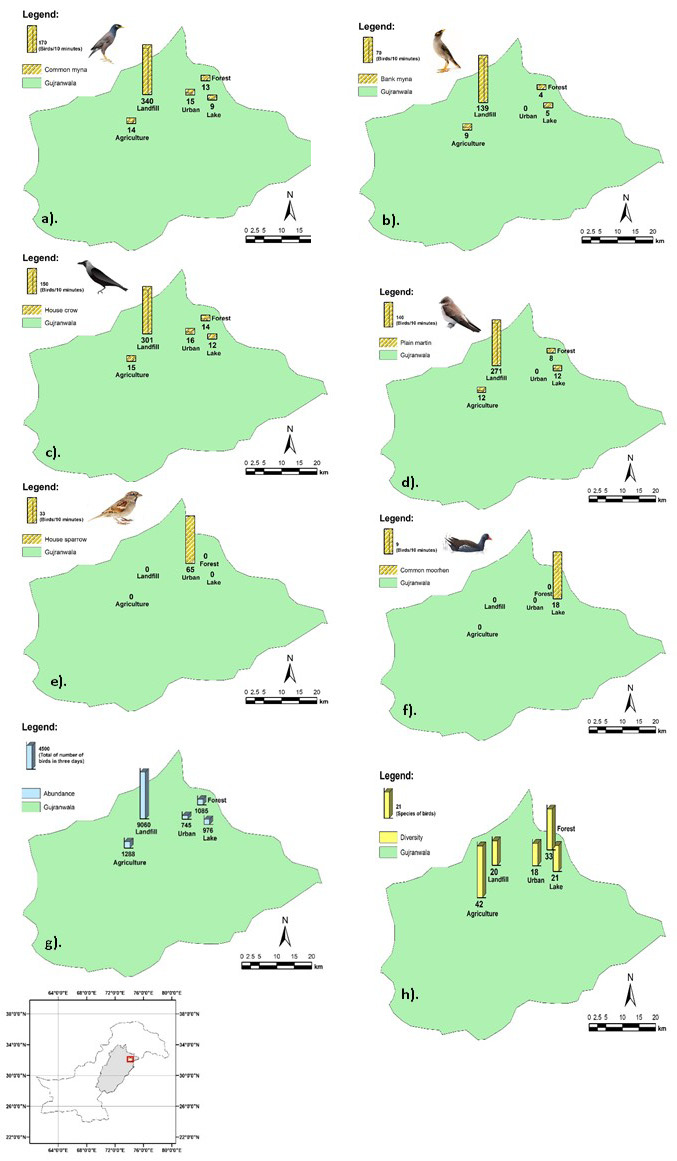
Fig. 2.
Maps showing spatial distribution of selected wildlife avifauna based on field data (birds per 10 min) from the agriculture, landfill, urban, forest and lake sites. Abundance (Figure-g is the total number of birds) and diversity (Figure-h is the number of species) were also determined in this study.