View larger version:
Download Original File
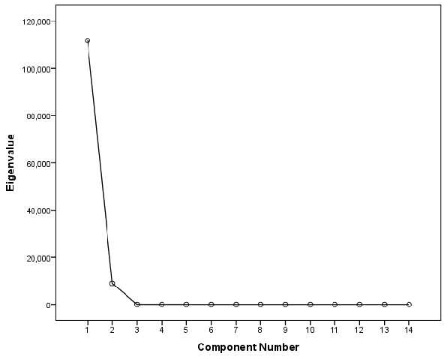
Figure 3:
Scree plot between different principal components and their eigenvalues.
