
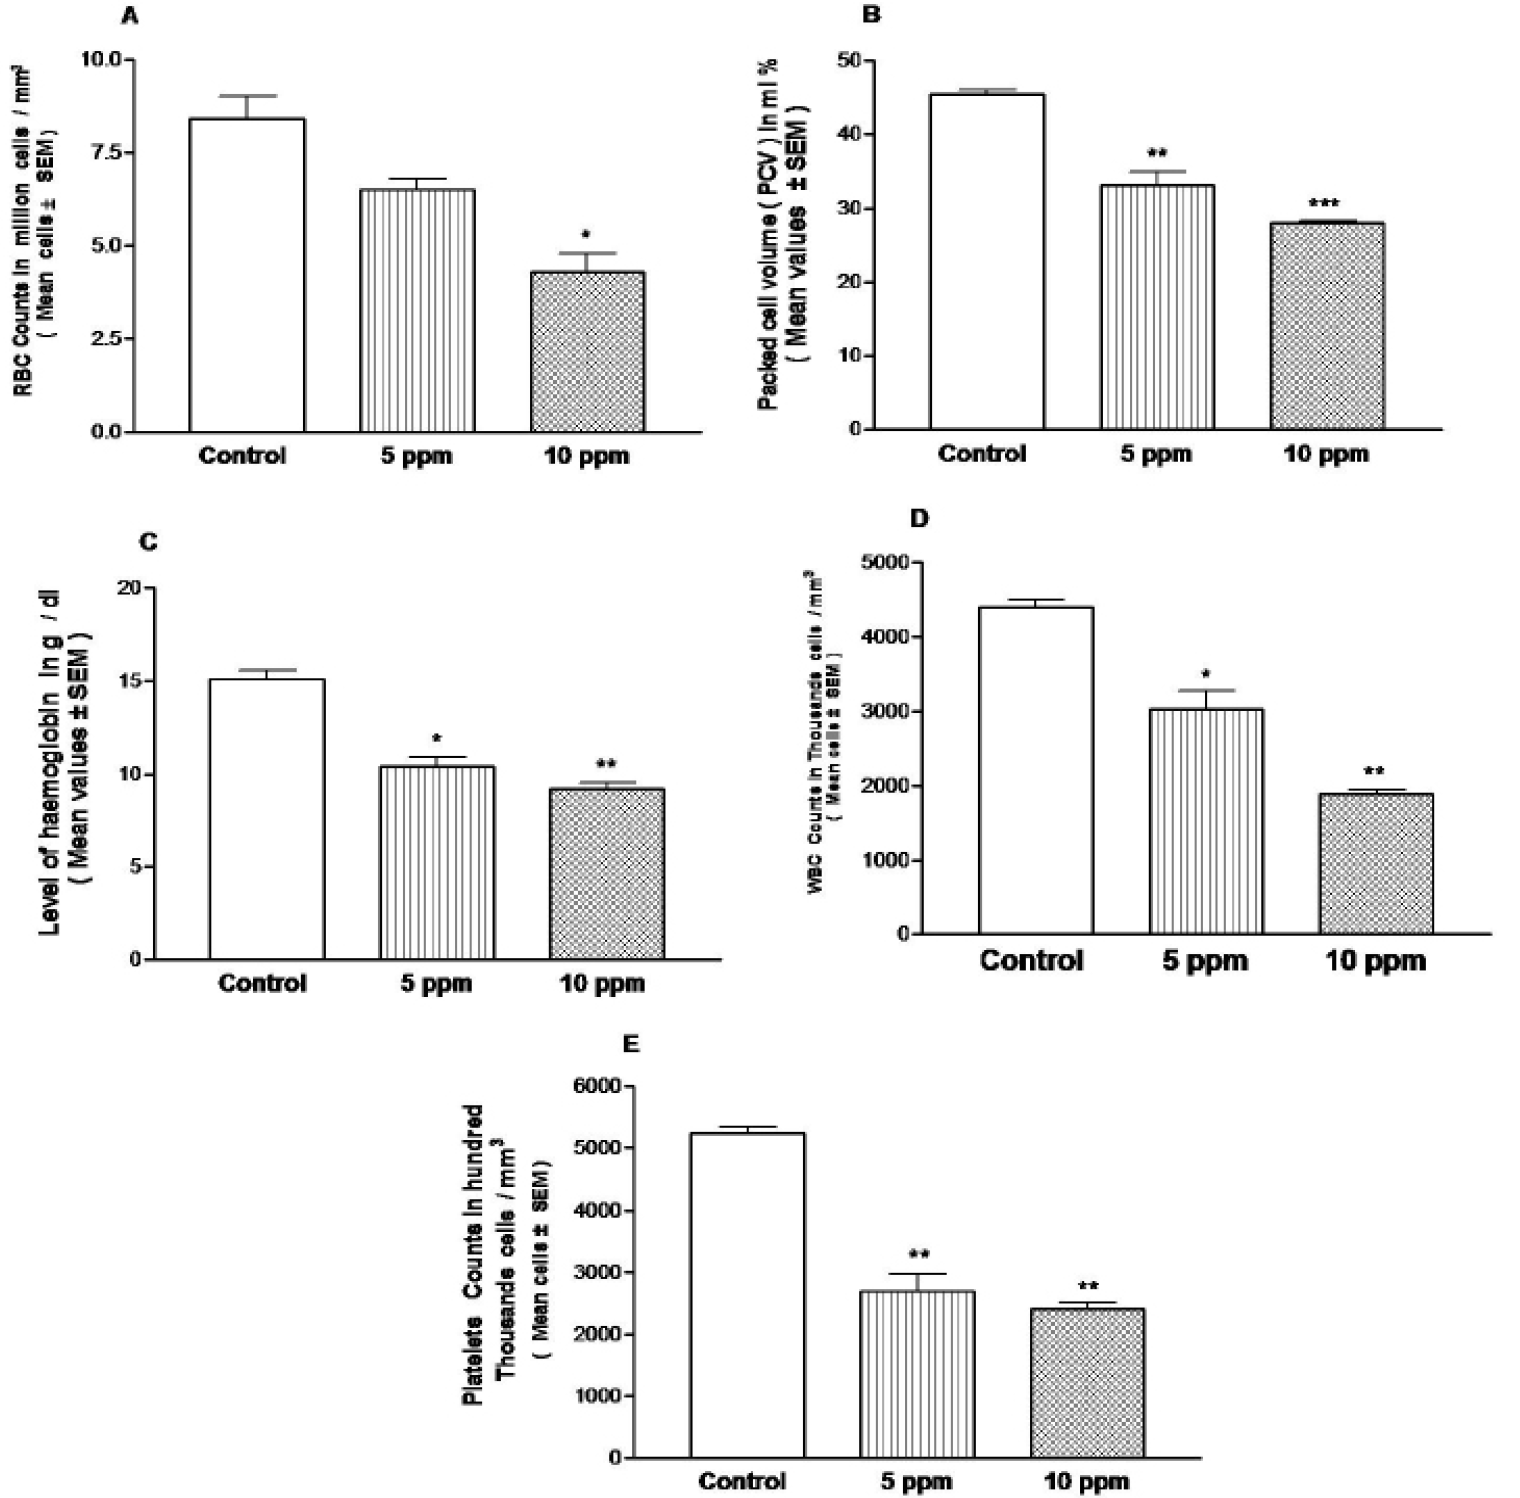
Fig. 3.
Effect of Hg toxicity on red blood cells (A), volume of packed red cells (B), hemoglobin content of mice (C), white blood cells (D), platelets (E) of mice offspring. *, ** and *** implied significant different at p<0.05, p<0.01 and p<0.001 level respectively from the control group by ANOVA.