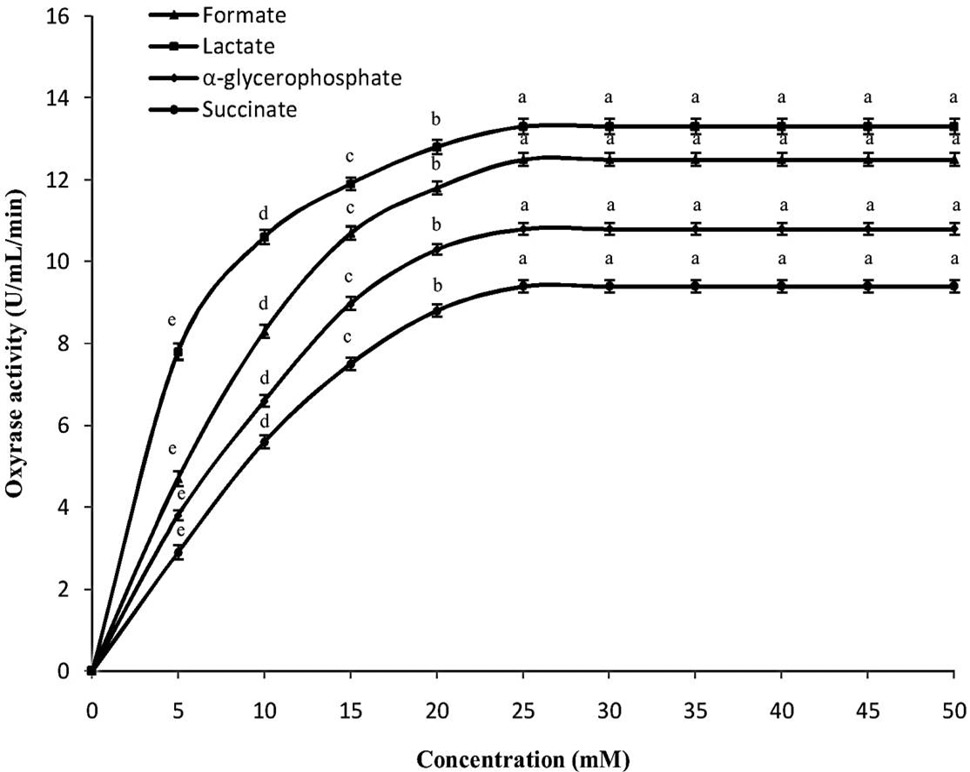
Fig. 3.
Effect of initial concentration of H+ donors on oxyrase activity; time 1.5 min, 57°C temperature, pH 8.5. Y-error bars represents the standard deviation among the triplicates. Each value is an average of three replicates, data labels followed by different letters differs significantly at ∝=0.05.