
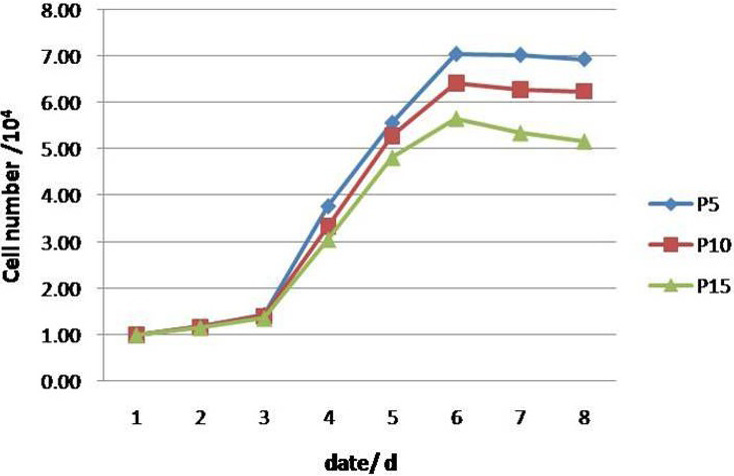
Fig. 4.
Growth curves of the AMSCs. The growth curves of P5, P10, and P15 AMSCs were all typical S curve with cell number represented by the vertical axis. The PDT was 31.23 h, 32.92 h and 35.04 h for P5, P10 and P15, respectively.
Growth curves of the AMSCs. The growth curves of P5, P10, and P15 AMSCs were all typical S curve with cell number represented by the vertical axis. The PDT was 31.23 h, 32.92 h and 35.04 h for P5, P10 and P15, respectively.