
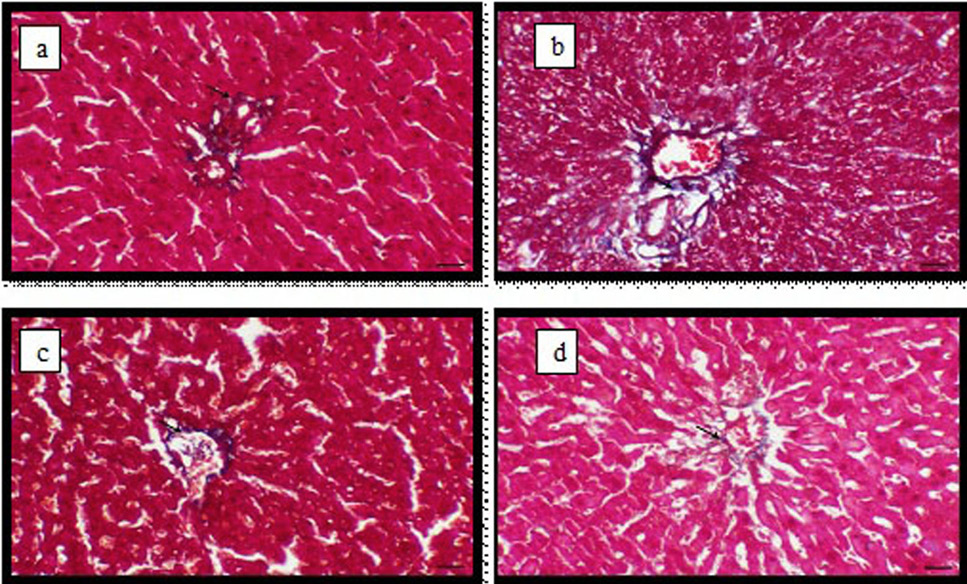
Fig. 5.
Light micrograph of liver, (a) control animals showing thin layer of periportal fibrous connective tissue (arrow); (b) PAT-treated animals showing increased the periportal fibrous connective tissue (arrow); (c) PAT and ginger (4weeks) animals showing thin layer of periportal fibrous connective tissue (arrow) and (d) PAT and ginger (8weeks) animals showing thin layer of periportal fibrous connective tissue (arrow), Masson’s trichrome staininig bar= 40 µm.