
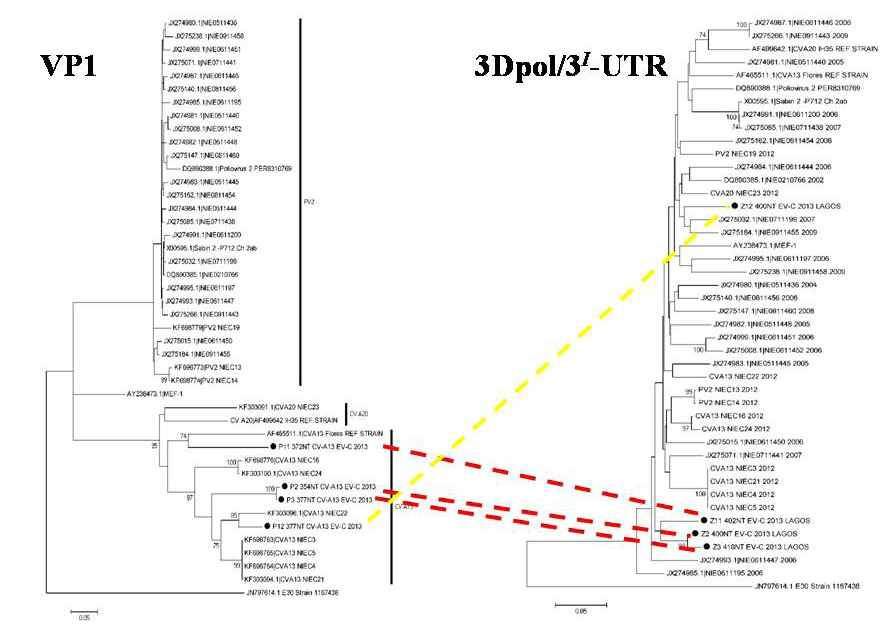
Figure 1: Phylogenetic relationship of selected isolates at VP1 and 3Dpol/3I-UTR region
The phylogram is based on an alignment of the VP1 (to the left) and 3Dpol/3I-UTR (to the right) sequences. The Lagos 2013 Isolates and/ or genomic regions are highlighted with black circles. Connecting lines are used to trace the locations of isolates of interest on both phylograms (RED for CVA13 with similar 3Dpol/3I-UTR region and YELLOW for the CVA13 isolate that might have recombined with some of the cVDPV 2s previously reported). The GenBank accession number, strain ID and year of isolation are indicated in the 3Dpol/3I-UTR region tree only, if known. Bootstrap values are indicated if >70%.