
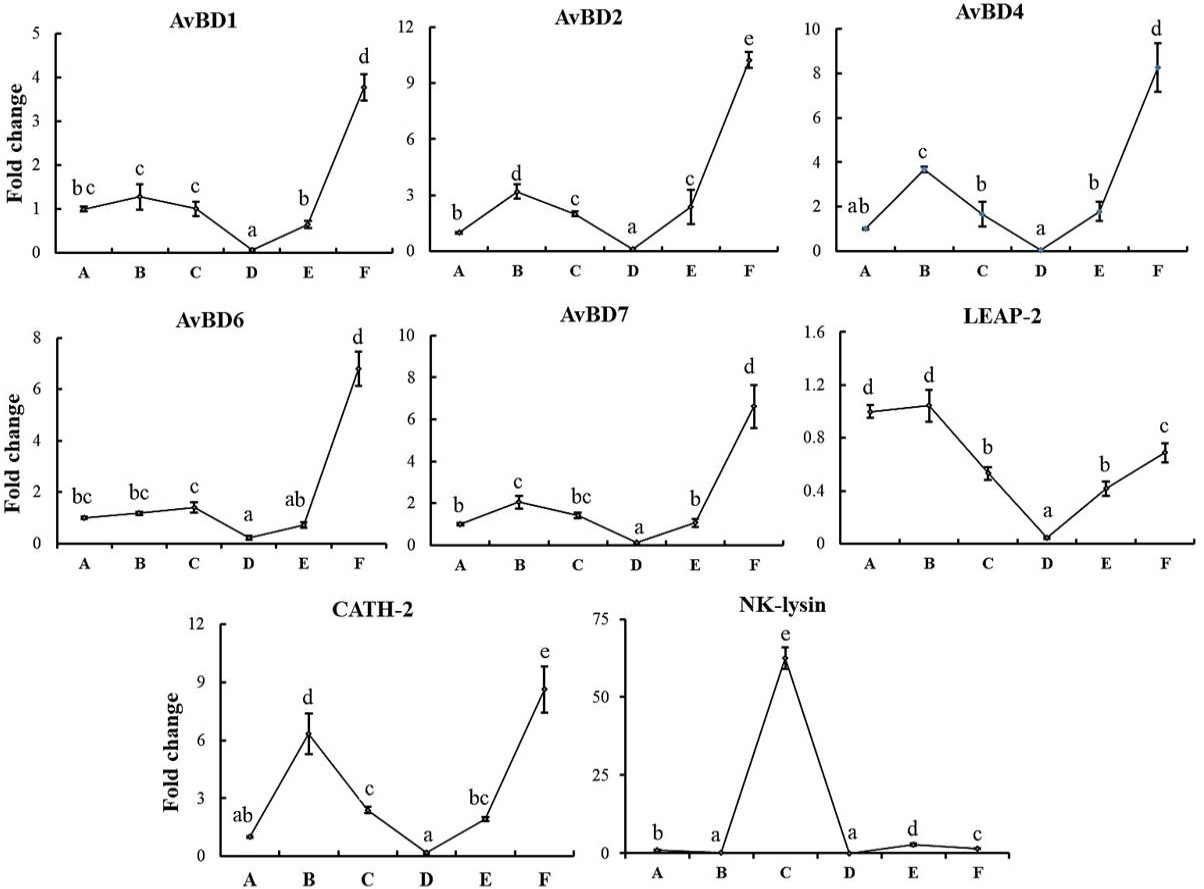
Fig. 3.
The changes in the expression levels of mRNAs of HDPs in chicken erythrocytes of 23-day-old broilers. Basal diet groups (A, B and C) treated with 0, 20, 50 μg/kg of recombinant glutathione-S-transferase A3 (rGSTA3) protein, and thiram-containing diet groups (D, E and F) treated with 0, 20, 50 μg/kg of rGSTA3 protein, respectively. In each panel, different lowercase letters (a–e) indicate statistically significant differences (P < 0.05).