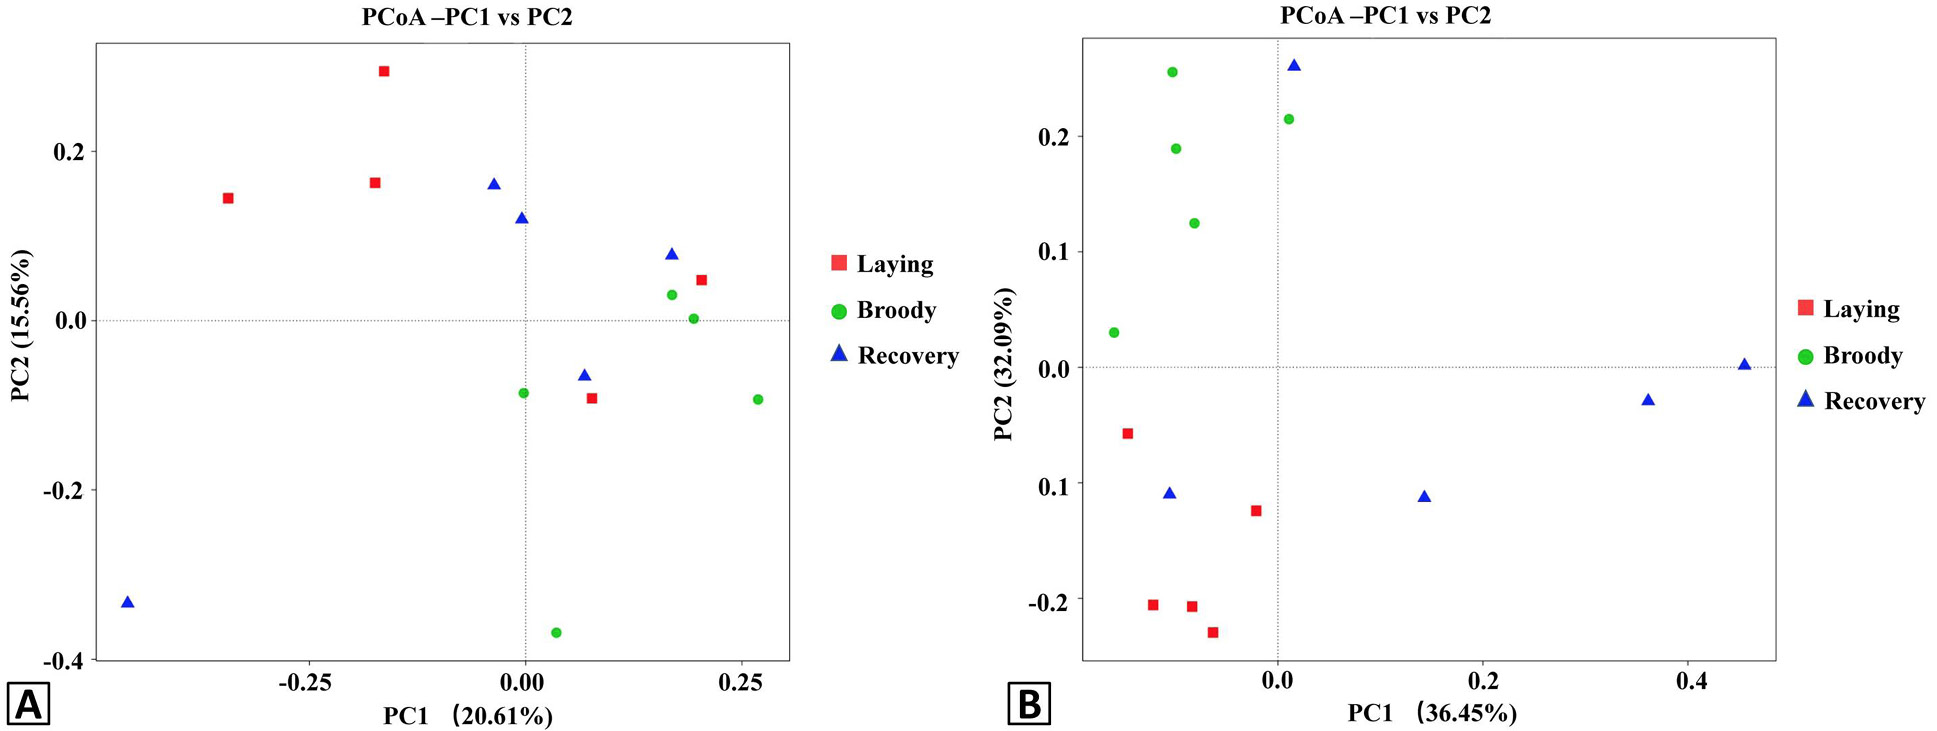
Fig. 5
Principal Coordinate Analysis (PCoA) plots of the duodenal bacteria community structures of the three groups using unweight (A) and weight (B) UniFrac distance metrics. Red, green and blue colors represent the laying, broody and recovery samples, respectively. PC1 and PC2 represent two principal components, and the percentage represents the contribution of the principal component to the sample difference. Samples with high community structure similarity tend to cluster together, while samples with large community differences tend to be far apart.