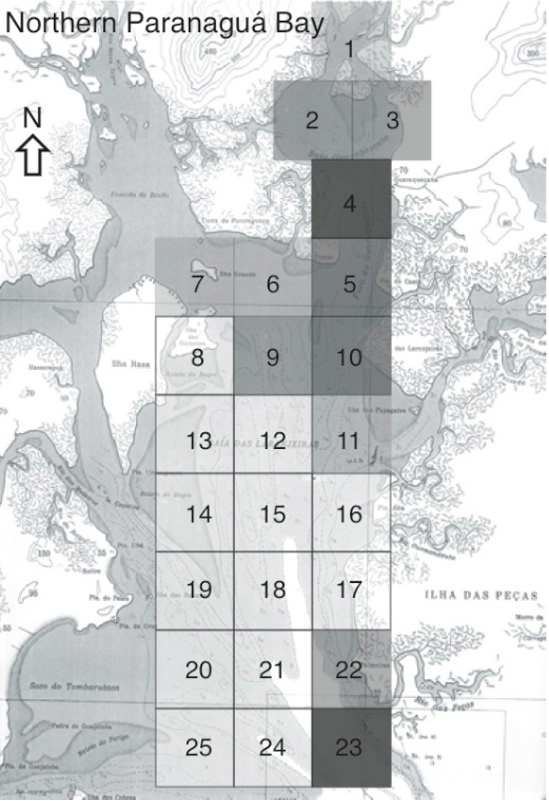
Fig. 4.
Habitat preferences for S. guianensis in the Paranaguá Bay estuary. Squares on the map are shaded according to the percentage of dolphin group sighting records relative to the total for the study area. Darker to light shading on squares corresponds to percentage of records according to five categories: > 10%; 5-10%; 5-1%; <1% of total dolphin sighting records.