
Fig. 5.
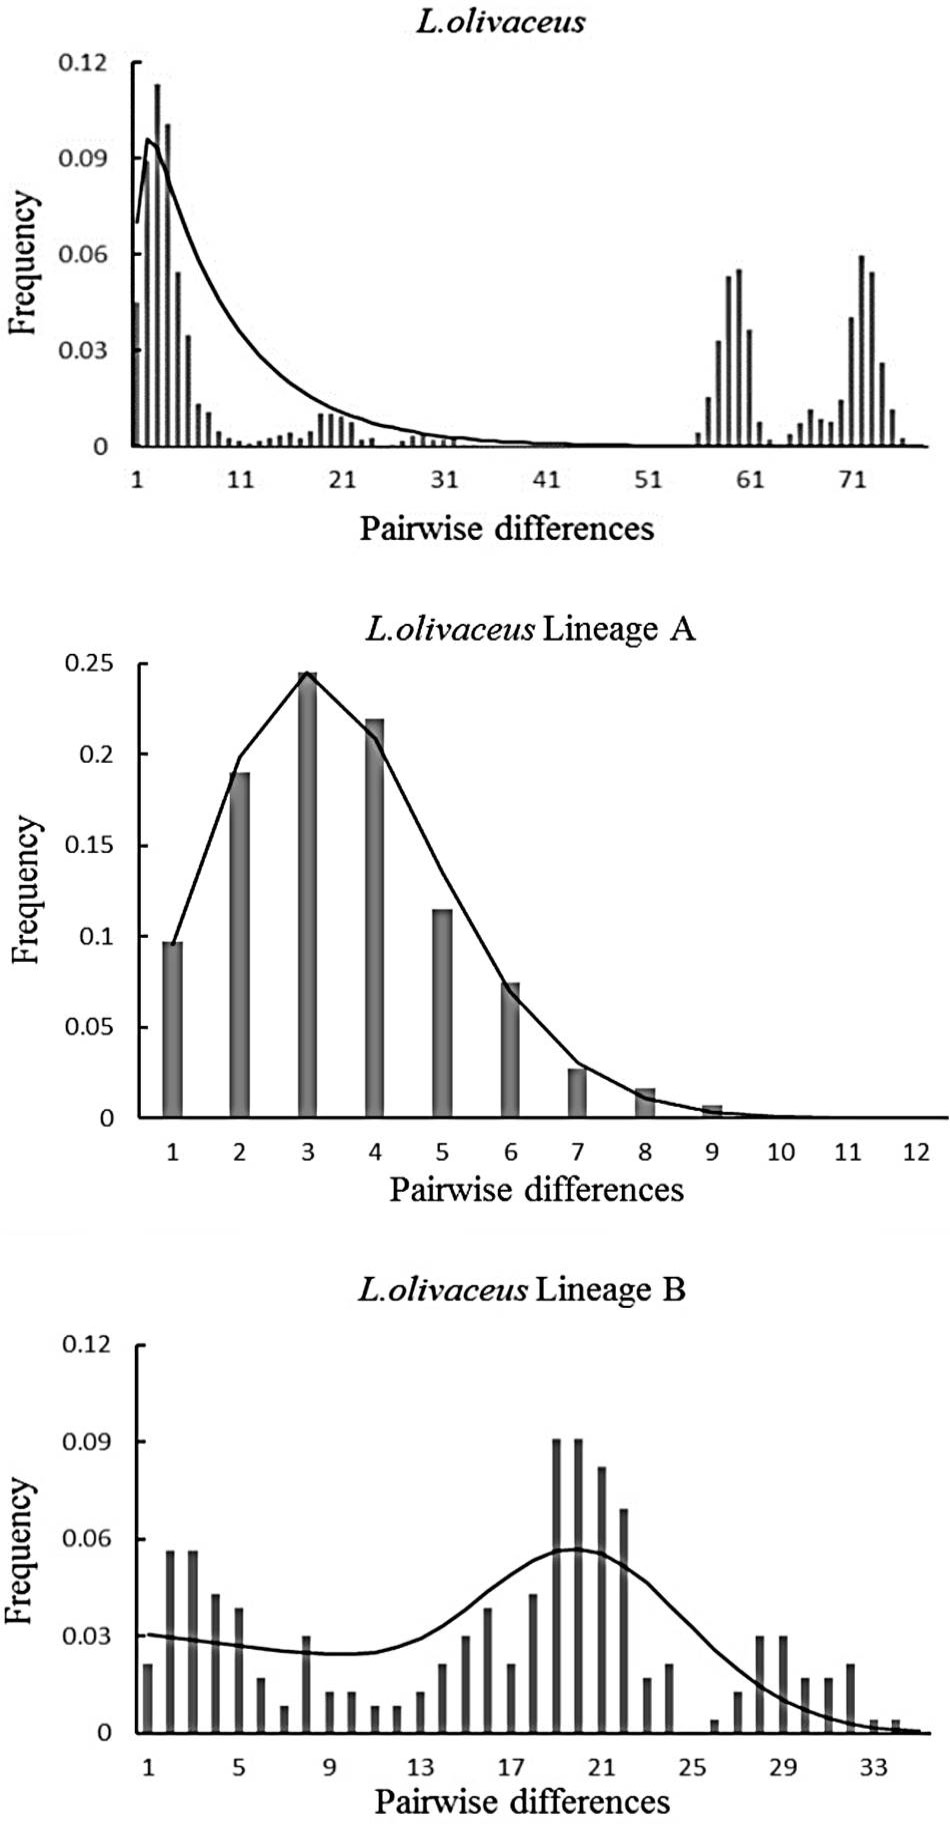
The observed pairwise difference (bars), and the expected mismatch distributions under the sudden expansion model (solid line) of control region haplotypes in L. olivaceus.
The observed pairwise difference (bars), and the expected mismatch distributions under the sudden expansion model (solid line) of control region haplotypes in L. olivaceus.