
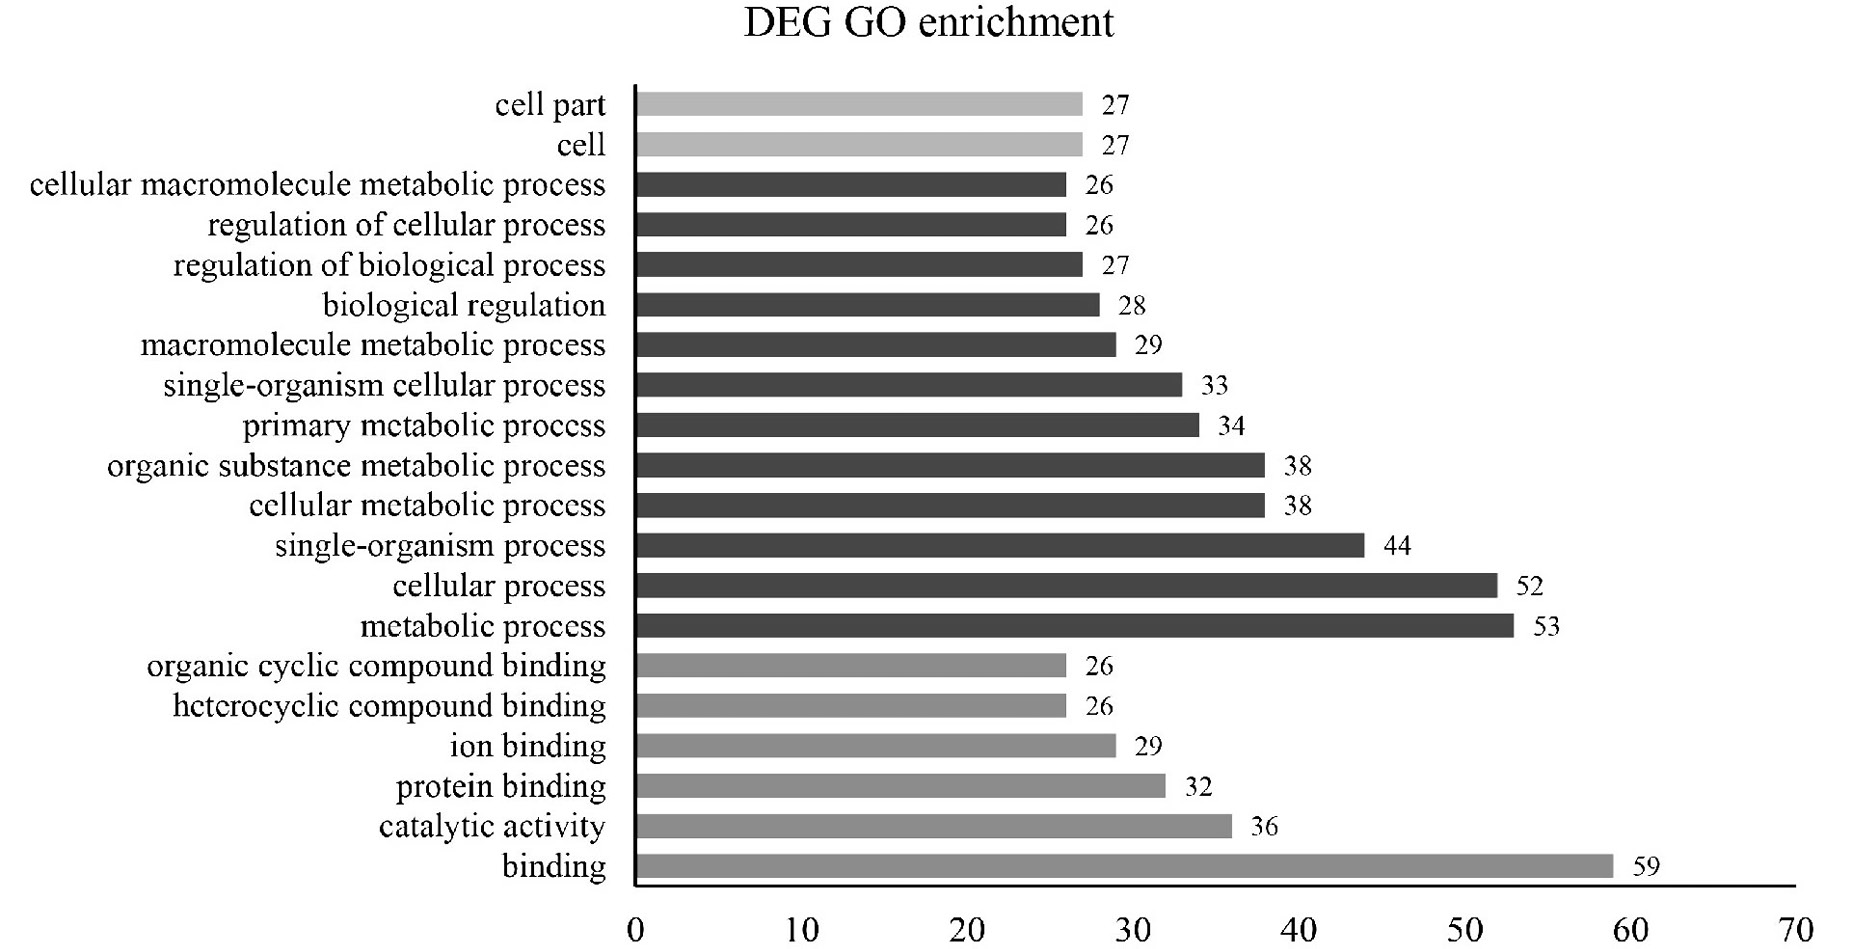
Fig. 7.
Bar graph showing enriched gene ontology (GO) terms for differentially expressed genes (DEGs) between the female and male antennae.
Bar graph showing enriched gene ontology (GO) terms for differentially expressed genes (DEGs) between the female and male antennae.