
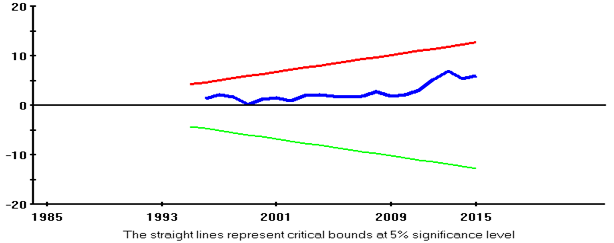
Figure 1:
Plot of cumulative sum of recursive residuals.
Red lines shows the upper control limit, green shows lower control limit and blue shows average drawn from original data.
Red lines shows the upper control limit, green shows lower control limit and blue shows average drawn from original data.