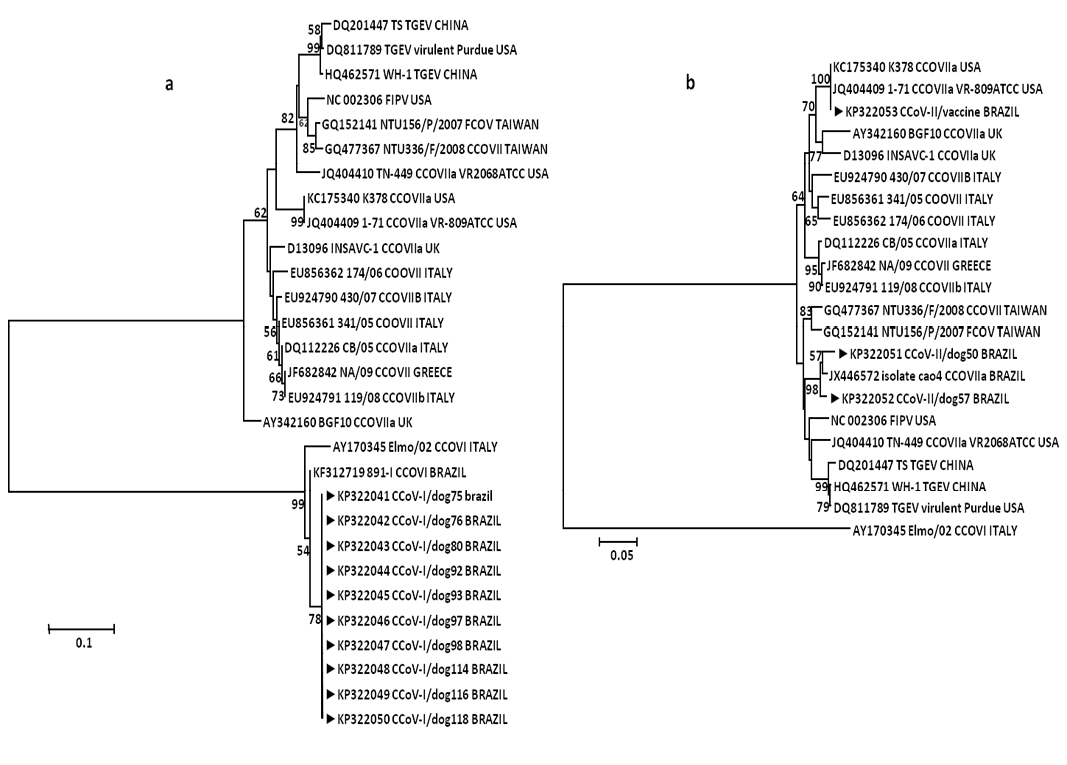
Figure 2
Neighbor-joining nucleotides trees (MCL model) for partial sequences of spike gene of a. CCoV type I and b. CCoV type II genes; arrows indicate strains form this study. Numbers at each node are bootstrap values (1,000 replicates). The bar represents the number of substitutions per site.