Figure 7
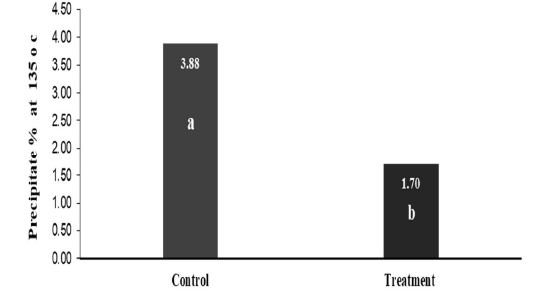
Milk heat precipitation of control and treatment groups. Superscript letters (a, b) show significant differences between control and treatment groups (P 0.05).
Milk heat precipitation of control and treatment groups. Superscript letters (a, b) show significant differences between control and treatment groups (P 0.05).