
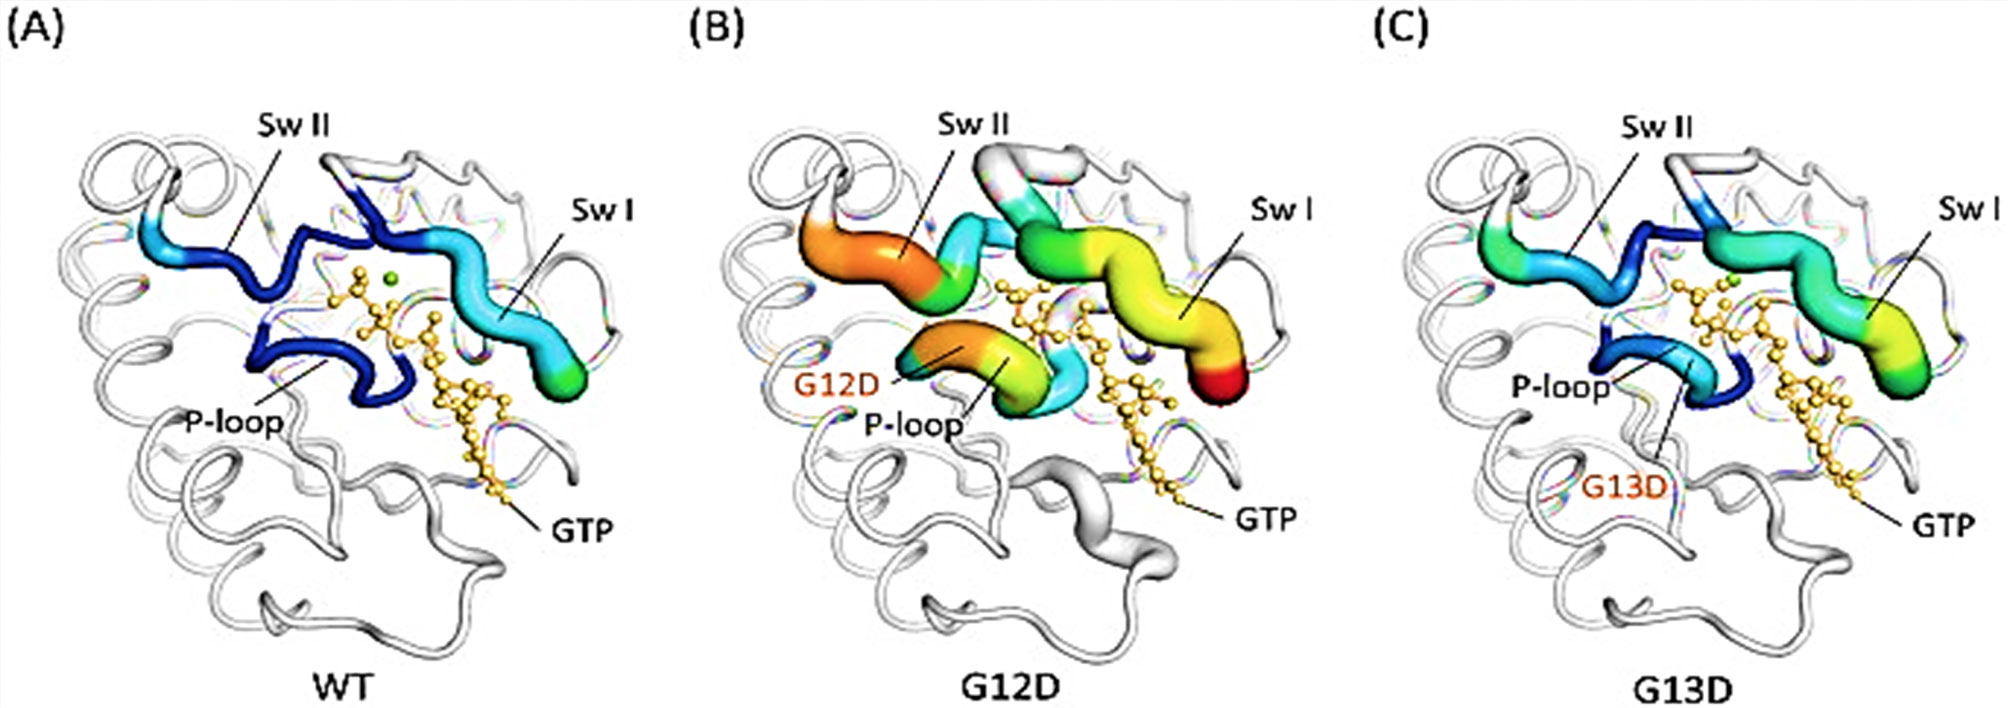
Fig. 4.
The structures of (A) WT, (B) G12D and, (C) G13D KRAS proteins are drawn in cartoon putty representations at the P-loop, switch I and II regions; blue represents the lowest and red the highest B-factor value. In addition, the size of the tube reflects the value of the B-factor, in that the larger the B-factor, the thicker the tube. The structures in the other regions are coloured in white and displayed in cartoon tube representation, where the size of the tube is independent of the B-factors (Figure adapted from Chen et al., 2013).