Fig. 3.
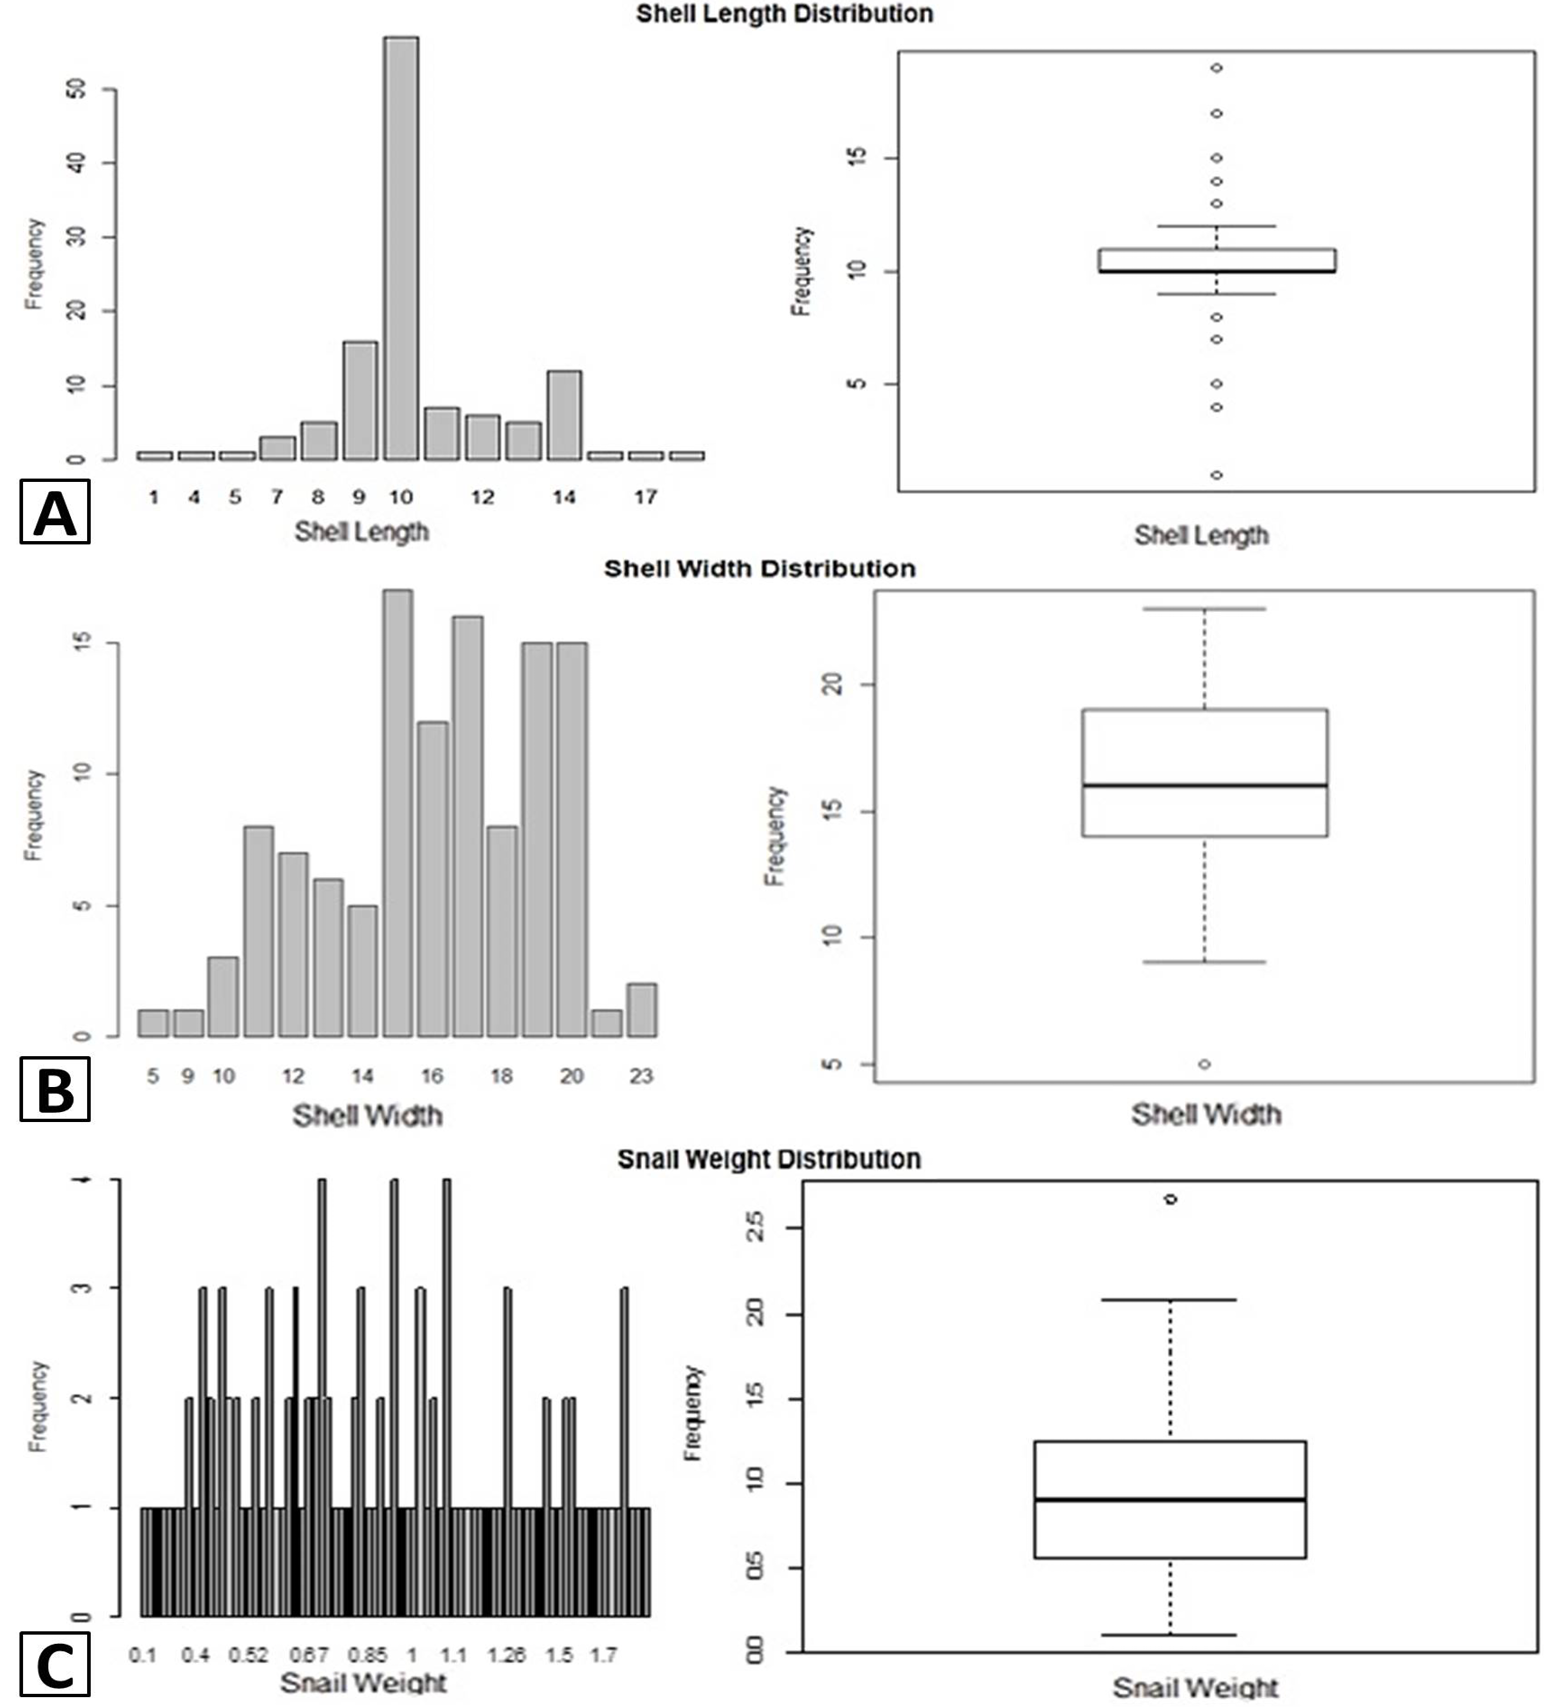
Graphical and box plot presentation of shell length (A), shell width (B), and shell weight (C) distribution of Melanoides tuberculate.
Graphical and box plot presentation of shell length (A), shell width (B), and shell weight (C) distribution of Melanoides tuberculate.