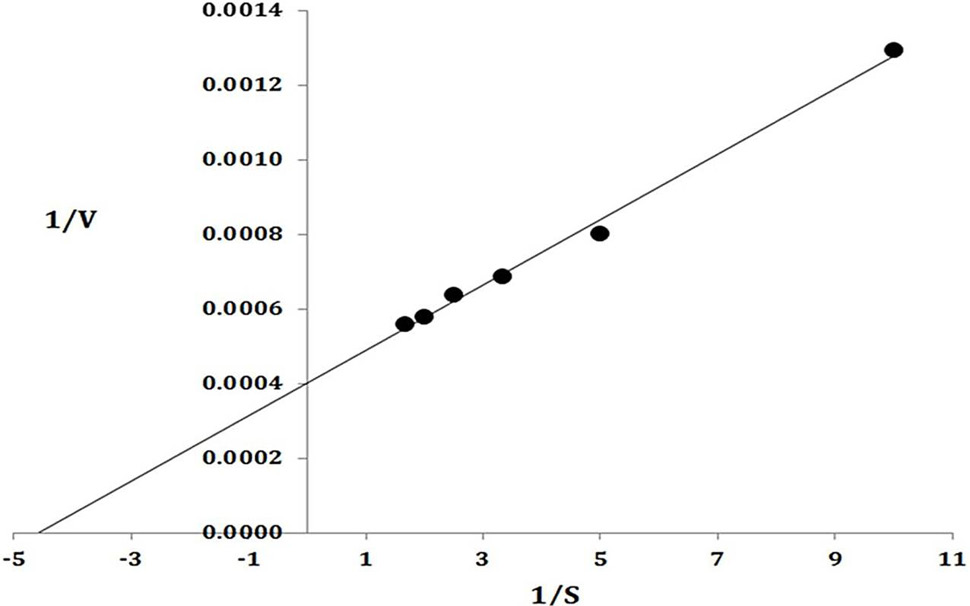
Lineweaver Burk plot. The data on X-axis indicate the 1/substrate while along Y-axis present 1/Velocity.
