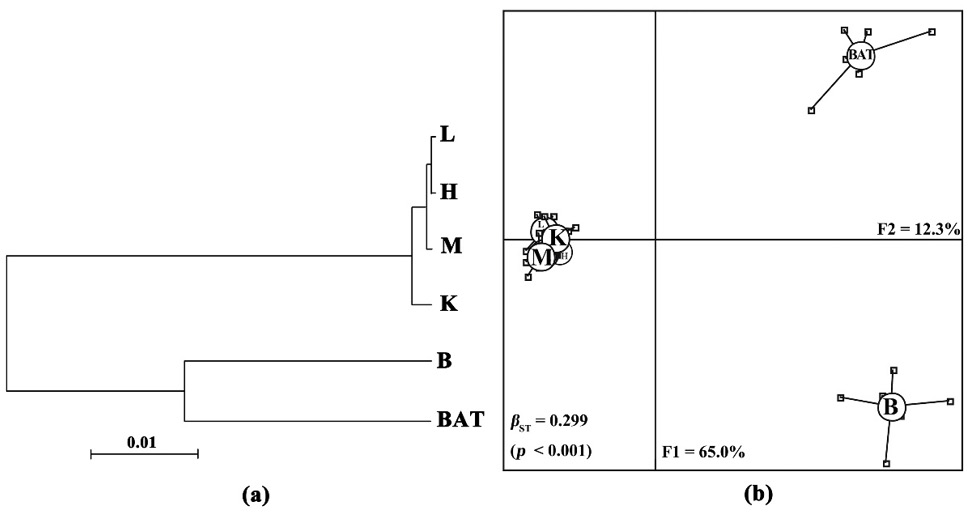
Fig. 2.
Epigenetic differentiation among six R. ferrumequinum tissues. (a) Clustering tree based on Nei’s unbiased epigenetic distance matrix. (b) Between-group eigen analysis using PCA values based on the epigenetic covariance matrix; the F1 and F2 axes explain 77.3% of the total variance (p < 0.001).