
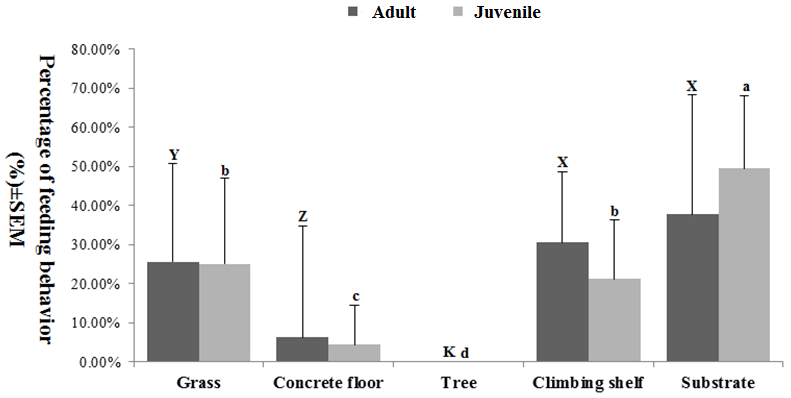
Fig. 1.
Feeding time distribution of adult and juvenile captive giant pandas in different locations. a, b, c, d: Different superscripts indicate significant differences in the feeding times of adult giant pandas between different locations (p<0.01). X, Y, Z, K: Different superscripts indicate significant differences in the feeding times of juvenile giant pandas between different locations (p<0.01). The data are presented as the mean ± SEM.