
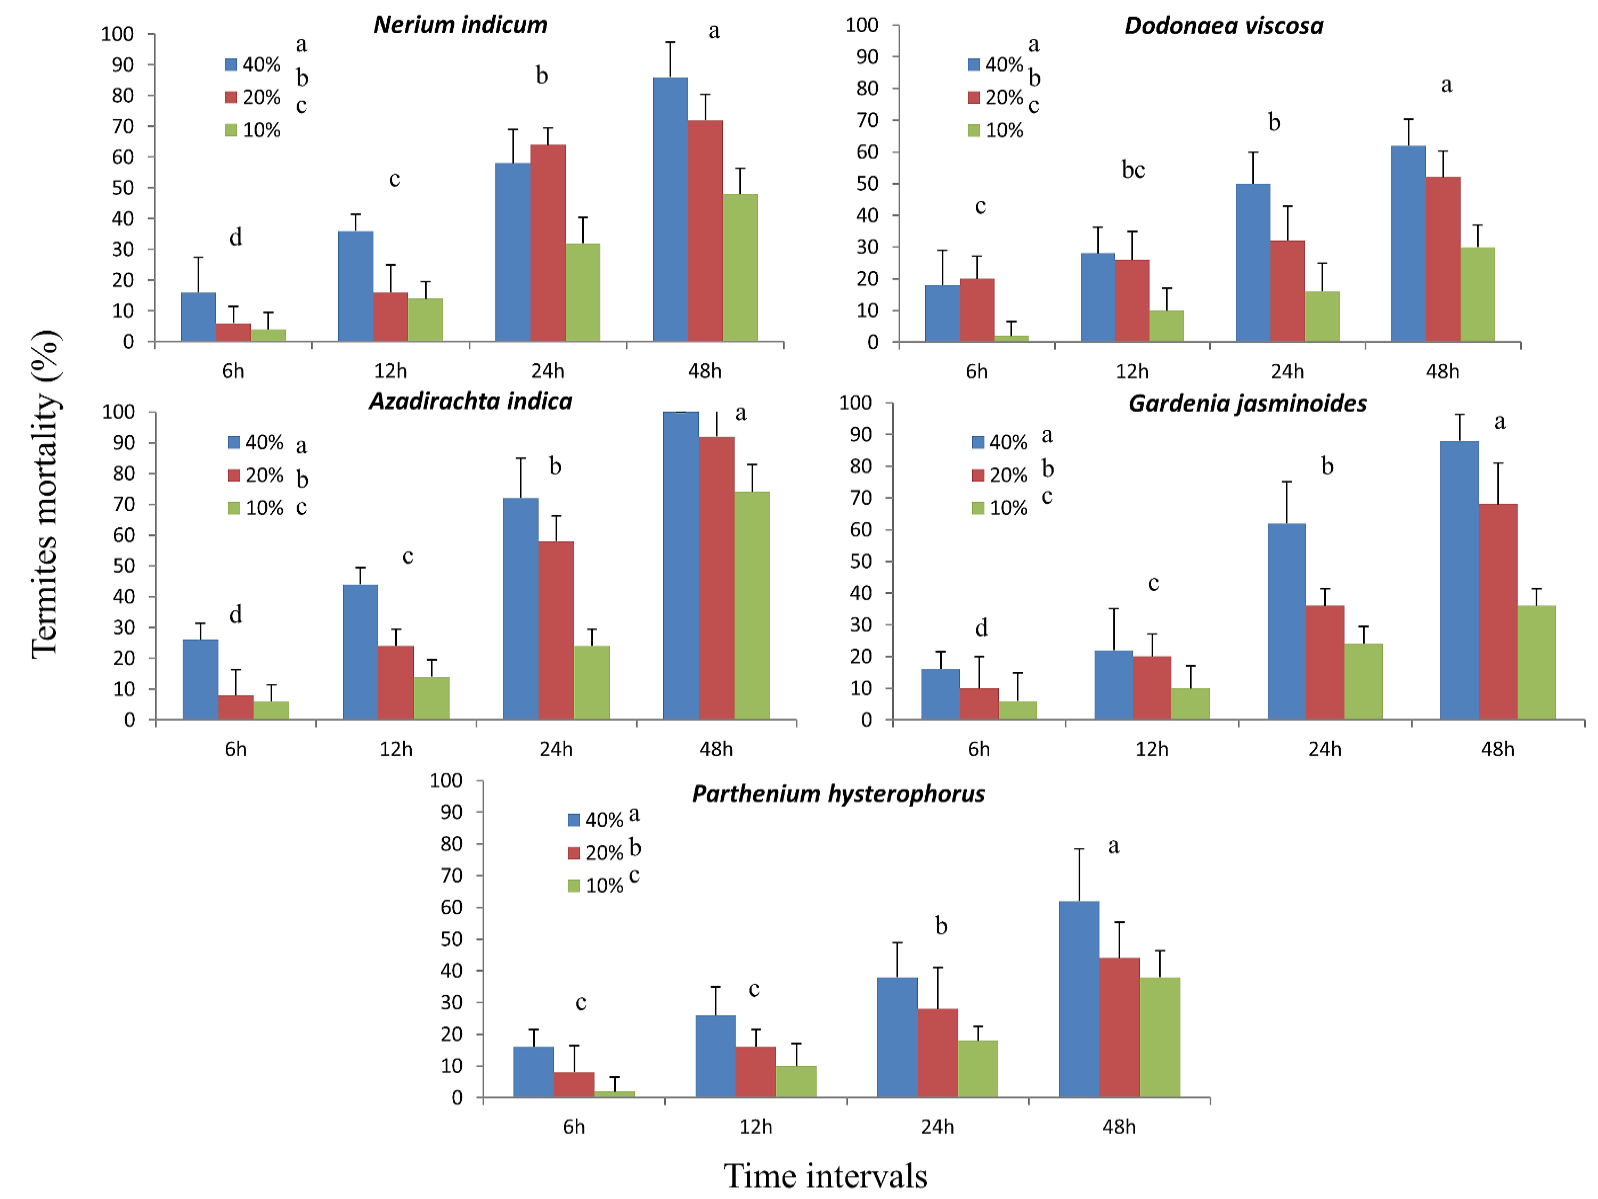
Figure 1:
Percent mortality of termite (Odontotermes obesus) individuals exposed to methanolic extracts of different plants. Columns represent average percent mortality of worker termites ± standard error (n = 5). For each botanical extract, different alphabets indicate statistical difference among the concentrations and time intervals (one-way factorial ANOVA; LSD at α = 0.05).