
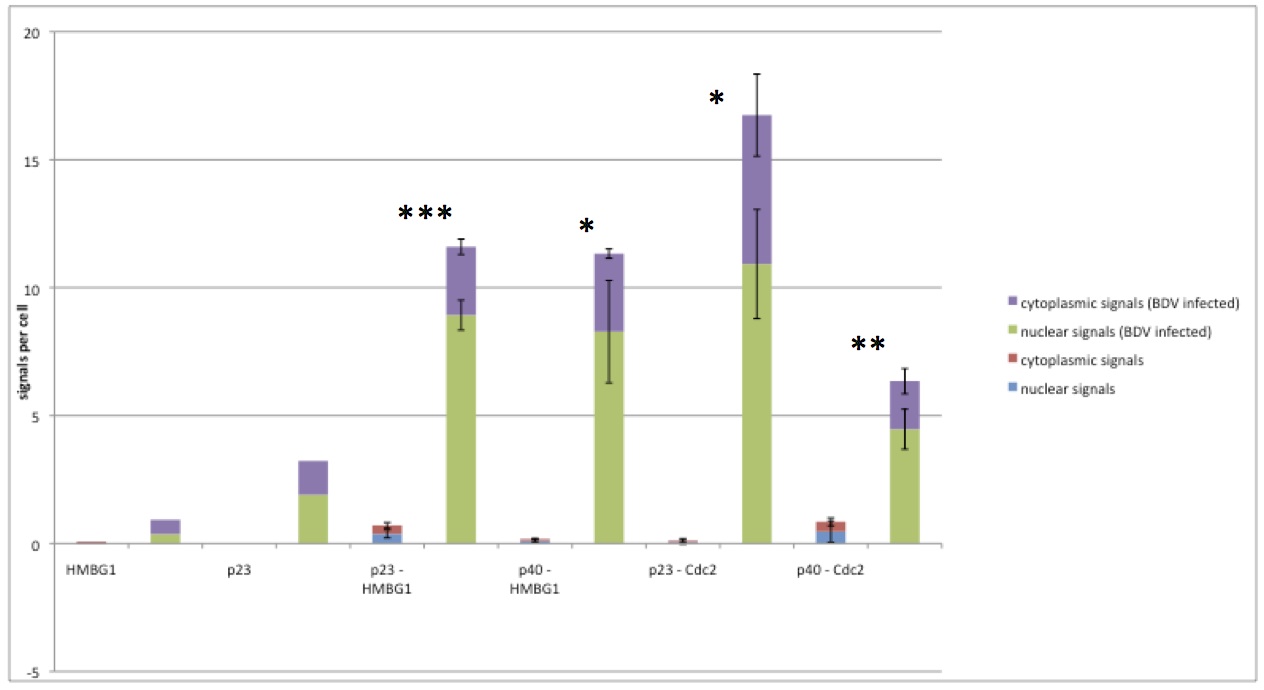
Quantification of host-virus protein-protein interactions in persistently infected cell cultures
The images of the same experiments as shown in Figure 4 were analyzed using Duolink ImageTool (Olink Bioscience). In total, three images were analyzed for each interaction. The number of signals per cell is shown as the cumulative nuclear (green for C6BV cells, blue for C6 cells) and cytoplasmic (purple for C6BV cells, red for C6 cells) signals of the indicated interaction. To the left, two technical controls are shown, where only one of the primary antibodies (as indicated) was used. All other steps were the same as for all other interactions. Statistical analysis (Student’s t-test) was performed using Microsoft Excel, where * indicates p≤0.05, ** p≤0.01 and *** p≤0.001. p23 = BDV P. p40 = BDV N.