
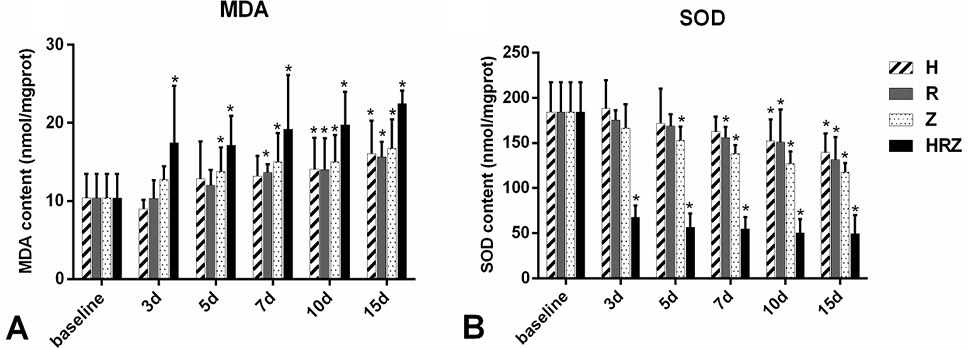
Fig. 3.
MDA content and SOD activity in different groups. Data are expressed as mean ± SD of n = 8 animals per group. *P<0.05.