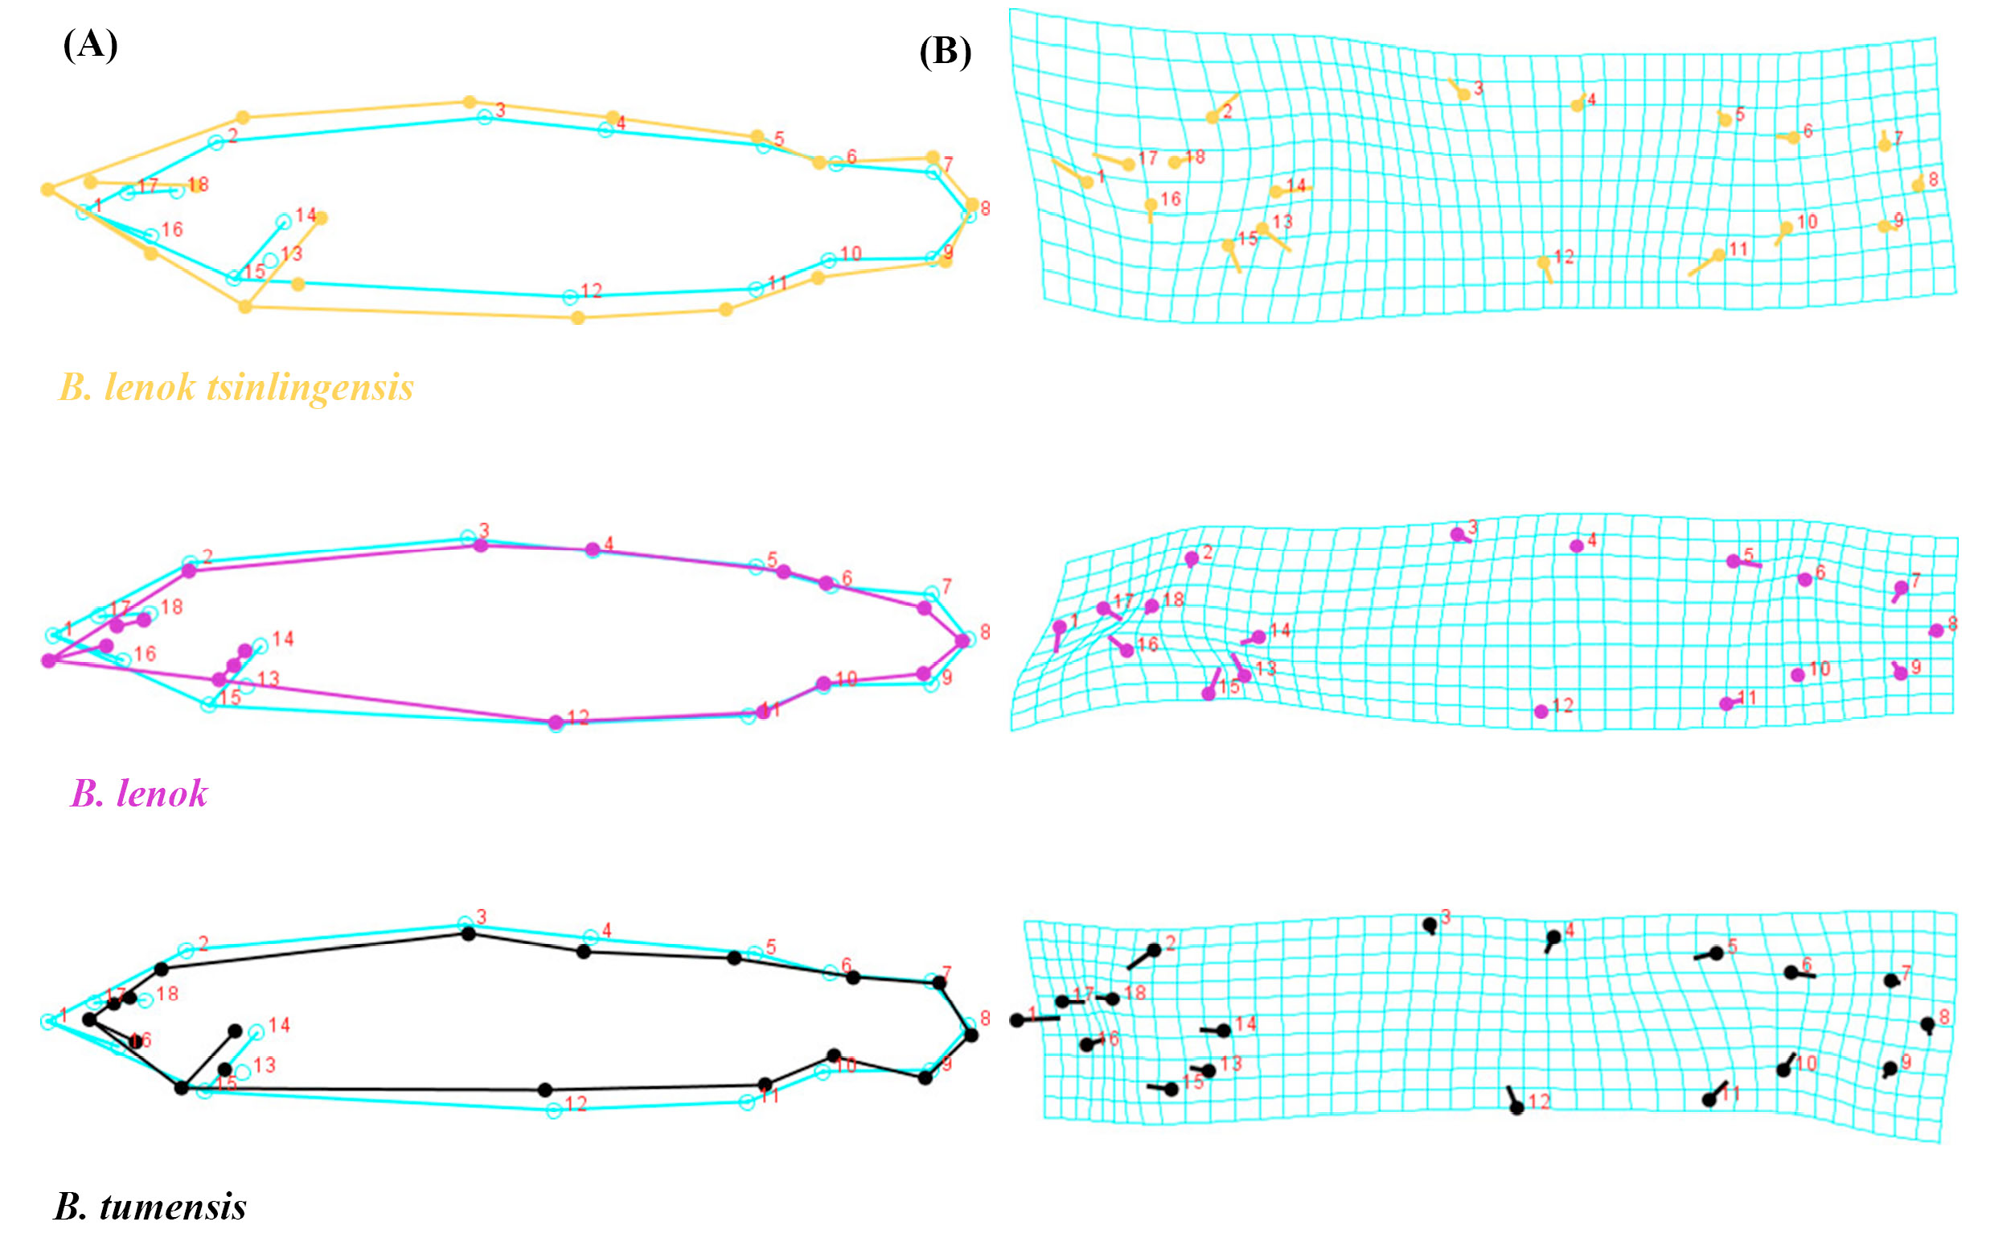
Fig. 3.
Variation visualization of three morphotypes of Brachymystax. A, the wireframes graphs of three morphotypes (scale factor = 4, bluish green line; bluish green points show average position of landmarks of all individuals); B, the transformation grids of three morphotypes (scale factor = 4).
