Figure 3
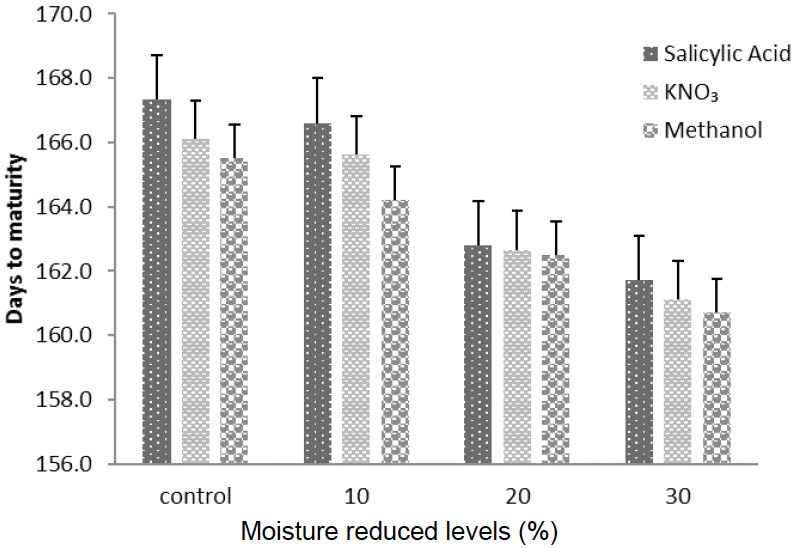
Interaction of moisture levels and chemicals for days to maturity of canola averaged over 2015-16 and 2016-17. Bars represent means + SE.
Interaction of moisture levels and chemicals for days to maturity of canola averaged over 2015-16 and 2016-17. Bars represent means + SE.