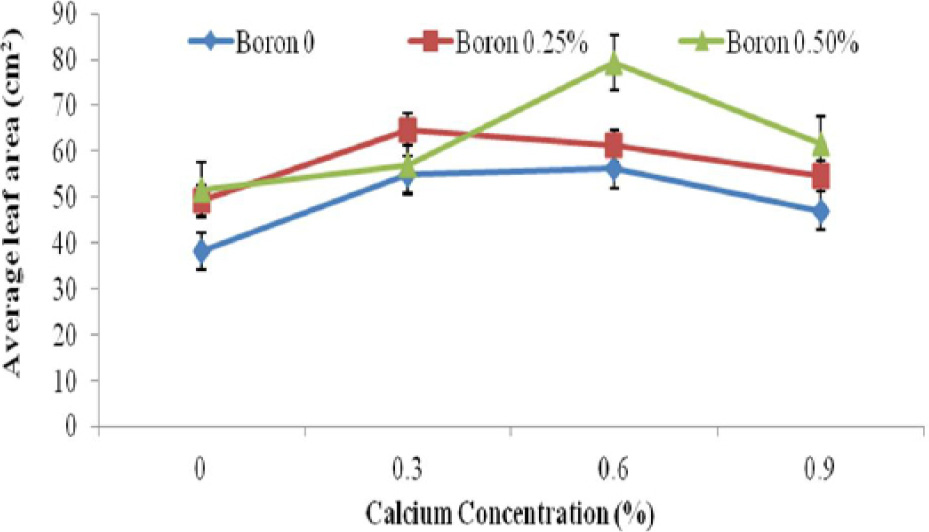
The interaction of Ca and B application on the leaf area of tomato. The vertical bars represent standard error.