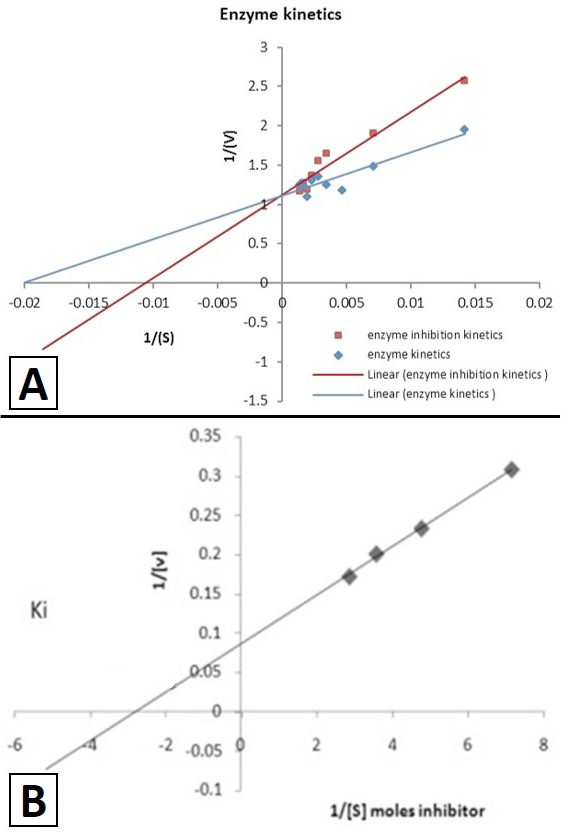
A, Lineweaver-Burk plot for the AChE for T. castaneum; B, graph shows the inhibition constant for saponin.