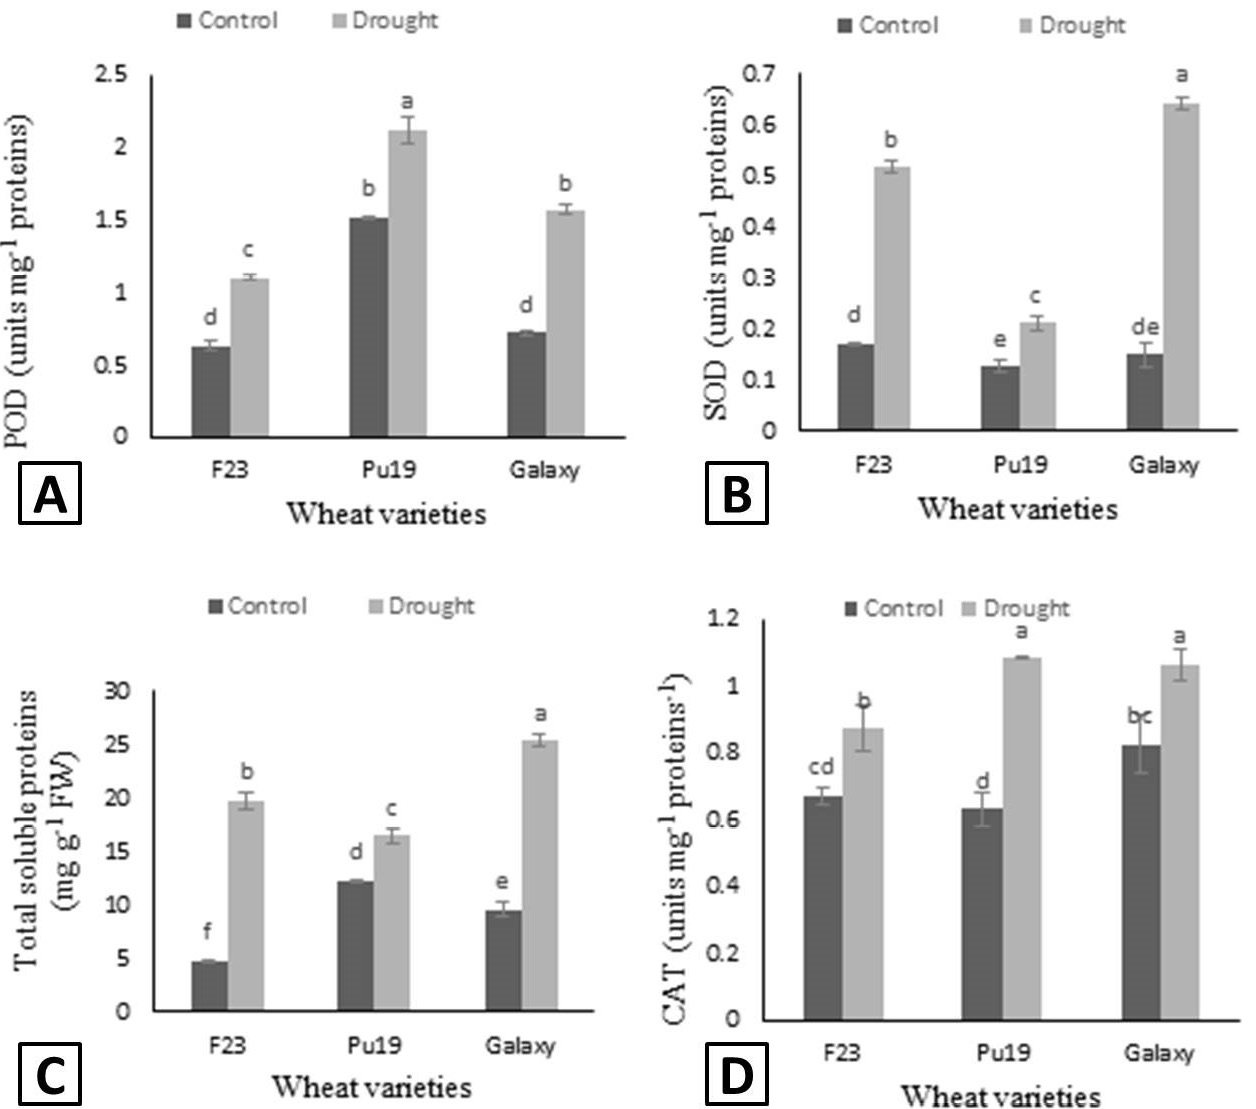
Figure 5:
POD (A), SOD (B) total soluble proteins (C) and CAT (D) measured in three different wheat varieties grown under control and drought condition. Different letters show the significant differences calculated by LSD at p<0.05. The data presented are mean values ± standard error of four replicates.